The Trend Micro CTF 2017 was run again this year between the 24th and 25th of June 2017. This is my solution to the 200 point forensics challenge. I was only able to complete around 90% of the challenge during the actual CTF, I didn’t complete it until a week after it was over.
The challenge started by providing us with a 260MB memory dump called VictimMemory.img, so I use Volatility to analyze the dump.
First I want to know what operating system the memory dump is for, this can be done with ‘imageinfo’ as shown below. Check out the Volatility command examples if you need further information on what all the options I use throughout this post do.
root@kali:~# volatility -f /root/tm/VictimMemory.img imageinfo
Volatility Foundation Volatility Framework 2.6
INFO    : volatility.debug    : Determining profile based on KDBG search...
          Suggested Profile(s) : Win7SP1x86_23418, Win7SP0x86, Win7SP1x86
                     AS Layer1 : IA32PagedMemoryPae (Kernel AS)
                     AS Layer2 : FileAddressSpace (/root/tm/VictimMemory.img)
                      PAE type : PAE
                           DTB : 0x185000L
                          KDBG : 0x8333ec28L
          Number of Processors : 1
     Image Type (Service Pack) : 1
                KPCR for CPU 0 : 0x8333fc00L
             KUSER_SHARED_DATA : 0xffdf0000L
           Image date and time : 2017-04-11 02:35:28 UTC+0000
     Image local date and time : 2017-04-11 11:35:28 +0900
The operating system appears to be Windows 7 32-bit, as per the suggested profiles. I started using the included Win7SP1x86 profile and had no problems with it.
While enumerating the memory dump, I noticed some suspicious processes running using ‘pstree’.
root@kali:~# volatility -f /root/tm/VictimMemory.img --profile=Win7SP1x86 pstree
Volatility Foundation Volatility Framework 2.5
Name                                                  Pid   PPid   Thds   Hnds Time
-------------------------------------------------- ------ ------ ------ ------ ----
 0x88bbaab8:explorer.exe                              940    356     31    865 2017-04-11 02:28:23 UTC+0000
. 0x8691c030:cmd.exe                                 4080    940      1     20 2017-04-11 02:32:02 UTC+0000
.. 0x88abfa78:svchost.exe                            3828   4080      1      7 2017-04-11 02:35:18 UTC+0000
We can see that svchost.exe is a child process of cmd.exe, interesting, let’s investigate further!
With Volatility I used ‘cmdscan’ to see commands that have been entered into cmd.exe.
root@kali:~# volatility -f /root/tm/VictimMemory.img --profile=Win7SP1x86 cmdscan
Volatility Foundation Volatility Framework 2.6
**************************************************
CommandProcess: conhost.exe Pid: 1868
CommandHistory: 0x33a338 Application: cmd.exe Flags: Allocated, Reset
CommandCount: 2 LastAdded: 1 LastDisplayed: 1
FirstCommand: 0 CommandCountMax: 50
ProcessHandle: 0x58
Cmd #0 @ 0x33a700: cd %temp%
Cmd #1 @ 0x2d3b38: svchost.exe 1.tmp 0x0 1
It appears that the directory was changed to %temp% and then the command ‘svchost.exe 1.tmp 0x0 1’ was run. This means that there should be a dodgy svchost.exe file within this directory, so let’s take a look at the open file handles to see if we can find it. In this case we use ‘handles’ against process ID 3828, our suspect svchost.exe process.
root@kali:~# volatility -f /root/tm/VictimMemory.img --profile=Win7SP1x86 handles -p 3828
Volatility Foundation Volatility Framework 2.6
Offset(V)     Pid     Handle     Access Type             Details
---------- ------ ---------- ---------- ---------------- -------
0x8db9f5e0   3828        0x4        0x3 Directory        KnownDlls
0x869342c0   3828        0x8   0x100020 File             \Device\HarddiskVolume1\Users\Taro\AppData\Local\Temp
0x89b6b420   3828        0xc   0x1f0003 Event
0x88baf038   3828       0x10   0x1f0001 ALPC Port
0x869e9d98   3828       0x14   0x1f0001 ALPC Port
0x9540c300   3828       0x18    0x20019 Key              MACHINE\SYSTEM\CONTROLSET001\CONTROL\NLS\SORTING\VERSIONS
0x88bb47c0   3828       0x1c   0x120089 File             \Device\HarddiskVolume1\Users\Taro\AppData\Local\Temp\1.tmp
The last file looks interesting, it’s in the %temp% directory and is called 1.tmp, which we know svchost.exe was executed against based on the command history.
Next I use ‘dumpfiles’ against our dodgy process 3828 to dump all associated files, which in this case includes both svchost.exe and 1.tmp.
root@kali:~# volatility -f /root/tm/VictimMemory.img --profile=Win7SP1x86 dumpfiles -p 3828 -D /tmp/hax
Volatility Foundation Volatility Framework 2.6
DataSectionObject 0x88bb47c0   3828   \Device\HarddiskVolume1\Users\Taro\AppData\Local\Temp\1.tmp
SharedCacheMap 0x88bb47c0   3828   \Device\HarddiskVolume1\Users\Taro\AppData\Local\Temp\1.tmp
ImageSectionObject 0x86942ad0   3828   \Device\HarddiskVolume1\Users\Taro\AppData\Local\Temp\svchost.exe
DataSectionObject 0x86942ad0   3828   \Device\HarddiskVolume1\Users\Taro\AppData\Local\Temp\svchost.exe
This created file.3828.0x86784ce0.vacb which is the 1.tmp file, and file.3828.0x8677fa30.img which is svchost.exe.
root@kali:~# file file.3828.0x86784ce0.vacb
file.3828.0x86784ce0.vacb: data
root@kali:~# file file.3828.0x8677fa30.img
file.3828.0x8677fa30.img: PE32 executable (console) Intel 80386, for MS Windows
Alternatively you could also use ‘dlllist’ and ‘dlldump’ options with Volatility to dump the svchost.exe file, as this is actually the way I did it I’ll include that way here too.
root@kali:~# volatility -f /root/tm/VictimMemory.img --profile=Win7SP1x86 dlllist -p 3828
Volatility Foundation Volatility Framework 2.5
************************************************************************
svchost.exe pid:   3828
Command line : svchost.exe  1.tmp 0x0 1
Service Pack 1

Base             Size  LoadCount Path
---------- ---------- ---------- ----
0x00ed0000     0x6000     0xffff C:\Users\Taro\AppData\Local\Temp\svchost.exe
0x77560000   0x13c000     0xffff C:\Windows\SYSTEM32\ntdll.dll
0x76080000    0xd4000     0xffff C:\Windows\system32\kernel32.dll
0x75730000    0x4a000     0xffff C:\Windows\system32\KERNELBASE.dll
0x6ac10000    0xee000     0xffff C:\Windows\system32\MSVCR120.dll
We can see that svchost.exe is found at 0x00ed0000, so we can dump that out with ‘dlldump’ as shown below. It’s also worth noting that ‘dlllist’ also showed us what we saw with ‘cmdscan’.
root@kali:~# volatility -f /root/tm/VictimMemory.img --profile=Win7SP1x86 dlldump -p 3828 -b 0x00ed0000 -D /tmp/hax
Volatility Foundation Volatility Framework 2.6
Process(V) Name                 Module Base Module Name          Result
---------- -------------------- ----------- -------------------- ------
0x88abfa78 svchost.exe          0x000ed0000 svchost.exe          OK: module.3828.a269a78.ed0000.dll
The svchost.exe file is a 32-bit executable, while 1.tmp appears to be shell code after a closer look through a hex editor. The contents of the 1.tmp file are shown below.
00020000   90               NOP
00020001   90               NOP
00020002   90               NOP
00020003   90               NOP
00020004   90               NOP
00020005   90               NOP
00020006   90               NOP
00020007   90               NOP
00020008   90               NOP
00020009   90               NOP
0002000A   90               NOP
0002000B   90               NOP
0002000C   90               NOP
0002000D   90               NOP
0002000E   90               NOP
0002000F   90               NOP
00020010   55               PUSH EBP
00020011   89E5             MOV EBP,ESP
00020013   83EC 60          SUB ESP,60
00020016   C645 DA A8       MOV BYTE PTR SS:[EBP-26],0A8
0002001A   C645 DB FF       MOV BYTE PTR SS:[EBP-25],0FF
0002001E   C645 DC 88       MOV BYTE PTR SS:[EBP-24],88
00020022   C645 DD D0       MOV BYTE PTR SS:[EBP-23],0D0
00020026   C645 DE B2       MOV BYTE PTR SS:[EBP-22],0B2
0002002A   C645 DF F6       MOV BYTE PTR SS:[EBP-21],0F6
0002002E   C645 E0 F8       MOV BYTE PTR SS:[EBP-20],0F8
00020032   C645 E1 EA       MOV BYTE PTR SS:[EBP-1F],0EA
00020036   C645 E2 FF       MOV BYTE PTR SS:[EBP-1E],0FF
0002003A   C645 E3 FF       MOV BYTE PTR SS:[EBP-1D],0FF
0002003E   C645 E4 D2       MOV BYTE PTR SS:[EBP-1C],0D2
00020042   C645 E5 FF       MOV BYTE PTR SS:[EBP-1B],0FF
00020046   C645 E6 FF       MOV BYTE PTR SS:[EBP-1A],0FF
0002004A   C645 E7 C2       MOV BYTE PTR SS:[EBP-19],0C2
0002004E   C645 E8 DC       MOV BYTE PTR SS:[EBP-18],0DC
00020052   C645 E9 C2       MOV BYTE PTR SS:[EBP-17],0C2
00020056   C645 EA D8       MOV BYTE PTR SS:[EBP-16],0D8
0002005A   C645 EB FF       MOV BYTE PTR SS:[EBP-15],0FF
0002005E   C645 EC F6       MOV BYTE PTR SS:[EBP-14],0F6
00020062   C645 ED FF       MOV BYTE PTR SS:[EBP-13],0FF
00020066   C645 EE FA       MOV BYTE PTR SS:[EBP-12],0FA
0002006A   C645 EF FF       MOV BYTE PTR SS:[EBP-11],0FF
0002006E   C645 BC 55       MOV BYTE PTR SS:[EBP-44],55
00020072   C645 BD 8B       MOV BYTE PTR SS:[EBP-43],8B
00020076   C645 BE EC       MOV BYTE PTR SS:[EBP-42],0EC
0002007A   C645 BF 51       MOV BYTE PTR SS:[EBP-41],51
0002007E   C645 C0 E8       MOV BYTE PTR SS:[EBP-40],0E8
00020082   C645 C1 00       MOV BYTE PTR SS:[EBP-3F],0
00020086   C645 C2 00       MOV BYTE PTR SS:[EBP-3E],0
0002008A   C645 C3 00       MOV BYTE PTR SS:[EBP-3D],0
0002008E   C645 C4 00       MOV BYTE PTR SS:[EBP-3C],0
00020092   C645 C5 58       MOV BYTE PTR SS:[EBP-3B],58
00020096   C645 C6 2D       MOV BYTE PTR SS:[EBP-3A],2D
0002009A   C645 C7 52       MOV BYTE PTR SS:[EBP-39],52
0002009E   C645 C8 1F       MOV BYTE PTR SS:[EBP-38],1F
000200A2   C645 C9 34       MOV BYTE PTR SS:[EBP-37],34
000200A6   C645 CA 01       MOV BYTE PTR SS:[EBP-36],1
000200AA   C645 CB 2D       MOV BYTE PTR SS:[EBP-35],2D
000200AE   C645 CC 52       MOV BYTE PTR SS:[EBP-34],52
000200B2   C645 CD 1F       MOV BYTE PTR SS:[EBP-33],1F
000200B6   C645 CE 34       MOV BYTE PTR SS:[EBP-32],34
000200BA   C645 CF 01       MOV BYTE PTR SS:[EBP-31],1
000200BE   C645 D0 E8       MOV BYTE PTR SS:[EBP-30],0E8
000200C2   C645 D1 00       MOV BYTE PTR SS:[EBP-2F],0
000200C6   C645 D2 00       MOV BYTE PTR SS:[EBP-2E],0
000200CA   C645 D3 00       MOV BYTE PTR SS:[EBP-2D],0
000200CE   C645 D4 00       MOV BYTE PTR SS:[EBP-2C],0
000200D2   C645 D5 90       MOV BYTE PTR SS:[EBP-2B],90
000200D6   C645 D6 90       MOV BYTE PTR SS:[EBP-2A],90
000200DA   C645 D7 C9       MOV BYTE PTR SS:[EBP-29],0C9
000200DE   C645 D8 C3       MOV BYTE PTR SS:[EBP-28],0C3
000200E2   C645 D9 CC       MOV BYTE PTR SS:[EBP-27],0CC
000200E6   C645 A6 00       MOV BYTE PTR SS:[EBP-5A],0
000200EA   C645 A7 5B       MOV BYTE PTR SS:[EBP-59],5B
000200EE   C645 A8 00       MOV BYTE PTR SS:[EBP-58],0
000200F2   C645 A9 00       MOV BYTE PTR SS:[EBP-57],0
000200F6   C645 AA 00       MOV BYTE PTR SS:[EBP-56],0
000200FA   C645 AB 00       MOV BYTE PTR SS:[EBP-55],0
000200FE   C645 AC 00       MOV BYTE PTR SS:[EBP-54],0
00020102   C645 AD 00       MOV BYTE PTR SS:[EBP-53],0
00020106   C645 AE 2B       MOV BYTE PTR SS:[EBP-52],2B
0002010A   C645 AF 17       MOV BYTE PTR SS:[EBP-51],17
0002010E   C645 B0 00       MOV BYTE PTR SS:[EBP-50],0
00020112   C645 B1 19       MOV BYTE PTR SS:[EBP-4F],19
00020116   C645 B2 3F       MOV BYTE PTR SS:[EBP-4E],3F
0002011A   C645 B3 00       MOV BYTE PTR SS:[EBP-4D],0
0002011E   C645 B4 00       MOV BYTE PTR SS:[EBP-4C],0
00020122   C645 B5 00       MOV BYTE PTR SS:[EBP-4B],0
00020126   C645 B6 00       MOV BYTE PTR SS:[EBP-4A],0
0002012A   C645 B7 03       MOV BYTE PTR SS:[EBP-49],3
0002012E   C645 B8 00       MOV BYTE PTR SS:[EBP-48],0
00020132   C645 B9 13       MOV BYTE PTR SS:[EBP-47],13
00020136   C645 BA 00       MOV BYTE PTR SS:[EBP-46],0
0002013A   C645 BB 05       MOV BYTE PTR SS:[EBP-45],5
0002013E   C745 FC 16000000 MOV DWORD PTR SS:[EBP-4],16
00020145   C745 F4 00000000 MOV DWORD PTR SS:[EBP-C],0
0002014C   C745 F0 00000000 MOV DWORD PTR SS:[EBP-10],0
00020153   8B45 F0          MOV EAX,DWORD PTR SS:[EBP-10]
00020156   83F8 16          CMP EAX,16
00020159   73 70            JNB SHORT 000201CB
0002015B   8D55 DA          LEA EDX,DWORD PTR SS:[EBP-26]
0002015E   8B45 F0          MOV EAX,DWORD PTR SS:[EBP-10]
00020161   01D0             ADD EAX,EDX
00020163   0FB600           MOVZX EAX,BYTE PTR DS:[EAX]
00020166   0FB6C0           MOVZX EAX,AL
00020169   8945 F8          MOV DWORD PTR SS:[EBP-8],EAX
0002016C   8D55 A6          LEA EDX,DWORD PTR SS:[EBP-5A]
0002016F   8B45 F0          MOV EAX,DWORD PTR SS:[EBP-10]
00020172   01D0             ADD EAX,EDX
00020174   0FB600           MOVZX EAX,BYTE PTR DS:[EAX]
00020177   0FB6C0           MOVZX EAX,AL
0002017A   8945 F4          MOV DWORD PTR SS:[EBP-C],EAX
0002017D   837D F4 00       CMP DWORD PTR SS:[EBP-C],0
00020181   7E 0A            JLE SHORT 0002018D
00020183   8345 F8 01       ADD DWORD PTR SS:[EBP-8],1
00020187   836D F4 01       SUB DWORD PTR SS:[EBP-C],1
0002018B  ^EB F0            JMP SHORT 0002017D
0002018D   8B45 FC          MOV EAX,DWORD PTR SS:[EBP-4]
00020190   83E8 01          SUB EAX,1
00020193   0FB64405 BC      MOVZX EAX,BYTE PTR SS:[EBP+EAX-44]
00020198   0FB6C0           MOVZX EAX,AL
0002019B   2945 F8          SUB DWORD PTR SS:[EBP-8],EAX
0002019E   8B45 FC          MOV EAX,DWORD PTR SS:[EBP-4]
000201A1   83E8 01          SUB EAX,1
000201A4   0FB64405 BC      MOVZX EAX,BYTE PTR SS:[EBP+EAX-44]
000201A9   0FB6C0           MOVZX EAX,AL
000201AC   3145 F8          XOR DWORD PTR SS:[EBP-8],EAX
000201AF   D17D F8          SAR DWORD PTR SS:[EBP-8],1
000201B2   8B45 F8          MOV EAX,DWORD PTR SS:[EBP-8]
000201B5   89C1             MOV ECX,EAX
000201B7   8D55 DA          LEA EDX,DWORD PTR SS:[EBP-26]
000201BA   8B45 F0          MOV EAX,DWORD PTR SS:[EBP-10]
000201BD   01D0             ADD EAX,EDX
000201BF   8808             MOV BYTE PTR DS:[EAX],CL
000201C1   836D FC 01       SUB DWORD PTR SS:[EBP-4],1
000201C5   8345 F0 01       ADD DWORD PTR SS:[EBP-10],1
000201C9  ^EB 88            JMP SHORT 00020153
000201CB   90               NOP
000201CC   C9               LEAVE
000201CD   C3               RET
When executing svchost.exe we get the following output:
usage: this.exe <input file> <offset> <isLongSleep>
This matches what we’ve seen before from ‘cmdscan’, so I run it against the 1.tmp shell code in a Windows virtual machine with the same parameters to see what happens, it appears to create a new thread after a sleep then end.
M:\ctf>svchost.exe 1.tmp 0x0 1
file name is 1.tmp
offset is 0
Createthread successful!
M:\ctf>
Nothing really interesting is happening yet. At this point during the CTF I spent a few hours looking at the svchost.exe file with the free version of IDA and Ollydbg but didn’t really get anywhere. I knew I was close, and then the CTF ended. A week later I went back into Ollydbg and had another attempt. I spent ages stepping through the process but saw nothing of interest, then I remembered the output mentioned that a thread was created. I looked at the other threads through Ollydbg through the View > Threads menu, but that didn’t really help me, mostly because I don’t really know how to use the tool properly.
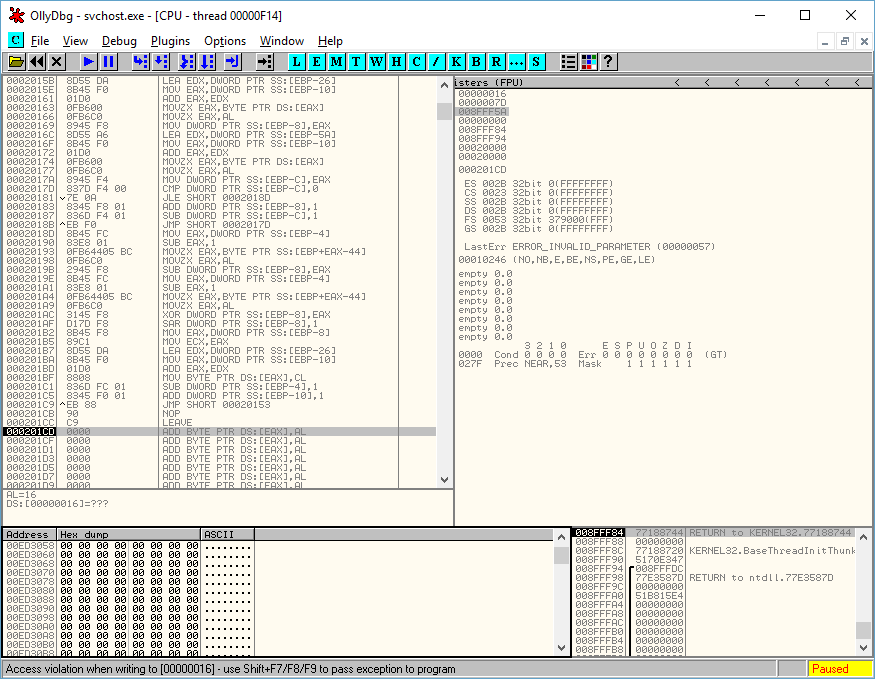
This is where my ghetto solution comes in, I decided to modify the shell code and simply remove the return at the end. I edited 1.tmp in a hex editor and changed the c3 for return to 00 and saved it. The idea was that when it got to this point it’d stop processing rather than return back. Ideally I’d go through and set a breakpoint at the appropriate location, but I wasn’t even able to find the shell code executing while looking manually, likely because I don’t know how to work with threads and am not very good at this.
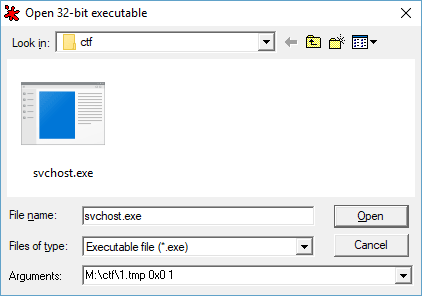
When you go to open svchost.exe in Ollydbg, in the arguments field you need to set ‘C:\path\to\1.tmp 0x0 1’ to run it against the shell code.
I loaded up Ollydbg with my modified file and executed it, it stopped as shown below, right at the end of the shell code as planned.
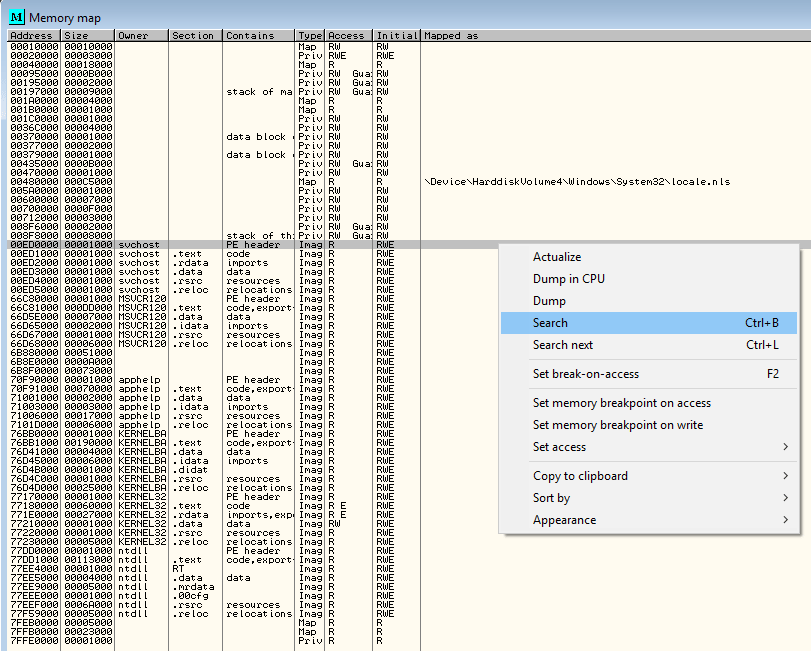
Next I wanted to see what was in memory at this point straight after the shell code had been executed. This can be done in Ollydbg by going to View > Memory, or by pressing the Alt + m shortcut. Once the memory map was open, I right clicked and selected search as shown below.
In this instance I knew that all flags started with the string ‘tmctf’, so I search for this.
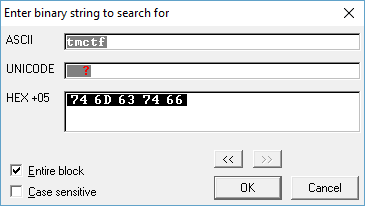
Sure enough this finds the flag in memory, which is TMCTF{static_analyzer}.

I checked memory many different times while stepping through the process and never found the flag until I was able to stop execution at the end of the shell code.
I admit this was a ghetto solution, perhaps one day I’ll learn how to use IDA/Ollydbg and friends properly.
0 Comments.