Both Windows and Linux operating systems are capable of acting as an NFS (Network File System) server, but which performs better? Here we are going to run various benchmarks on the two to see which performs better.
NFS has been around for a long time in UNIX based variants, and more recently Microsoft has added support within the Windows operating system, let’s find out how they compare.
The test environment
Out test environment contains the following servers.
- linux-client – 192.168.0.10: This is where all of the benchmarks are run from, linux-client runs CentOS 7.1
- linux-server – 192.168.0.20: This is our Linux NFS server running with CentOS 7.1
- windows-server – 192.168.0.30: This is our Windows NFS server running with Windows 2012 R2 Data Center Edition
All servers are running with 2GB of memory and 2 CPU cores, they were all fully up to date at the time of writing. All machines were running at the same resource levels on the same hardware, this way with everything is as equal and fair as possible with the key differences being the operating systems and their NFS implementations – exactly what we are benchmarking here.
The NFS servers are exporting their mounts with NFS version 4.1, additionally the linux-client server mounts the NFS mount point with “vers=4.1” specified to ensure that they are mounting as 4.1.
Below is a copy of the entries in the “/etc/fstab” file on the linux-client machine. One entry was commented out at a time, the one that was uncommented would be mounted to /mnt for benchmarking.
192.168.0.30:/nfs     /mnt    nfs vers=4.1,rw,async   0       0
#192.168.0.20:/root/nfs /mnt    nfs vers=4.1,rw,async       0       0
The linux-server and windows-server NFS servers had a dedicated 40gb disk attached which was used for the NFS mount, this disk was not being used for anything else except the NFS benchmark. A secondary disk was used to rule out any actions that the running OS may be performing during the benchmark.
The Windows server had its 40gb disk added as a lettered drive with an ‘nfs’ folder which was shared using the Server for NFS role in Windows Server 2012 R2, while the Linux server simply had its 40gb disk mounted to /root/nfs and exported by the NFS server.
Once mounted you can run the ‘nfsstat -m’ command on linux-client to confirm that vers=4.1 is set correctly, this is worth checking to ensure the same version of NFS is used in both tests against linux-server and windows-server so that we can compare against each other more accurately.
While the benchmarks from the linux-client machine were running, resources were monitored from both the client side and server side. There did not appear to be any high CPU or memory usage, just disk and network usage as expected.
The benchmarking process
The benchmarks were run using IOzone, a file system benchmarking tool that I found had a good reputation for NFS benchmarking.
In this instance we are going to benchmark, sequential read, sequential write, random read, and random write with IOzone, these are defined as below from the IOzone documentation.
- Read: This test measures the performance of reading an existing file.
- Write: This test measures the performance of writing a new file. When a new file is written not only does the data need to be stored but also the overhead information for keeping track of where the data is located on the storage media. This overhead is called the “metadata” It consists of the directory information, the space allocation and any other data associated with a file that is not part of the data contained in the file. It is normal for the initial write performance to be lower than the performance of re-writing a file due to this overhead information.
- Random Read: This test measures the performance of reading a file with accesses being made to random locations within the file. The performance of a system under this type of activity can be impacted by several factors such as: Size of operating system’s cache, number of disks, seek latencies, and others.
- Random Write: This test measures the performance of writing a file with accesses being made to random locations within the file. Again the performance of a system under this type of activity can be impacted by several factors such as: Size of operating system’s cache, number of disks, seek latencies, and others.
As the documentation was not clear if the read/write tests were sequential, I sent a message to one of the IOzone developers who was able to confirm that those tests are indeed sequential.
Below is the command that was run over the NFS mount, which was mounted to /mnt on linux-client, as per the previous /etc/fstab configuration.
root@linux-client current]# ./iozone -Racz -g 2G -i 0 -i 1 -i 2 -U /mnt/ -f /mnt/testfile -b /root/windowsnfs.xls
This was run against both linux-server and windows-server by simply changing the mount point and xls file to write to as needed.
Results
Here are the results of our sequential write, sequential read, random write and random read tests on NFS mounts provided by both Windows and Linux NFS servers. The graphs can be found below, however if you are interested in the raw data you can download a copy of the spreadsheets that IOzone generated, all values are in KB.
https://www.rootusers.com/wp-content/uploads/2015/07/linuxnfs.xlsx
https://www.rootusers.com/wp-content/uploads/2015/07/windowsnfs.xlsx
In the graphs that follow as a result of the IOzone benchmarks, it is important to understand the three different metrics that are shown.
- File Size: This is simply the total size of the file that is being written to or read from disk.
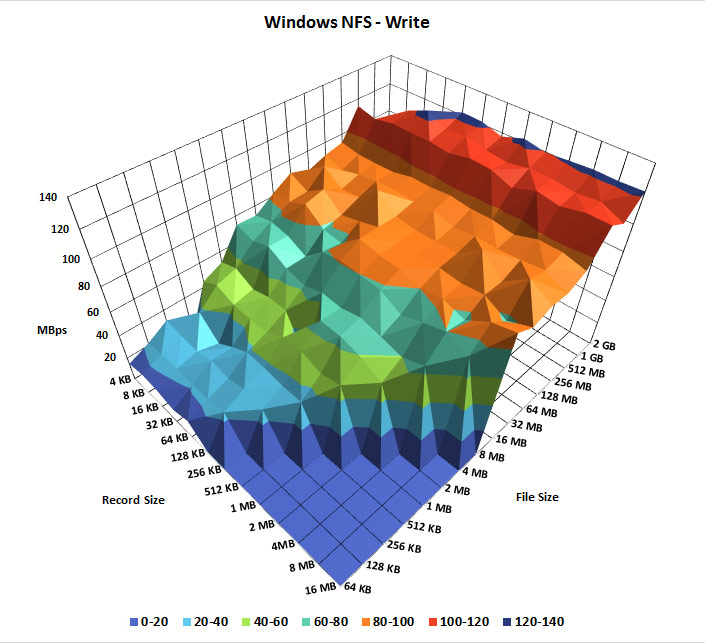
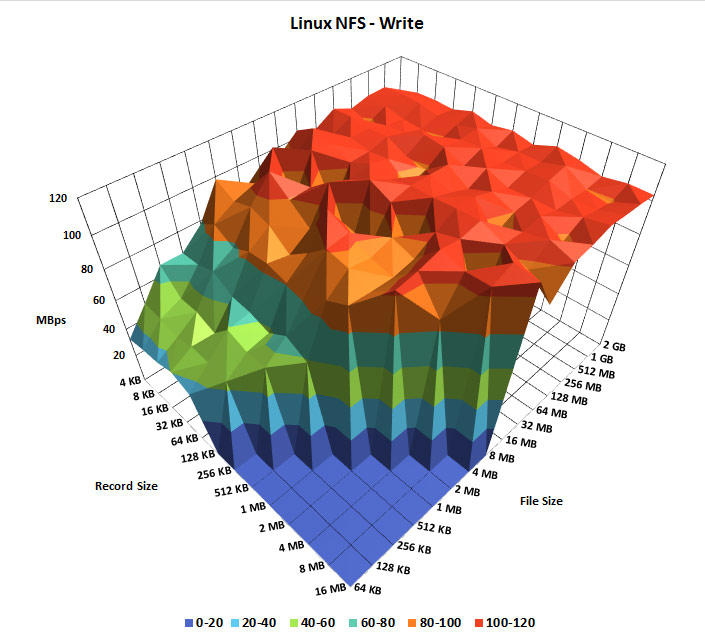
- Record Size: The file described above is broken up into a given size of records, think of them as sized chunks within the overall file. For example, a 64MB file can be made up from 8 8MB records, or 4 16MB records. This shows as ‘reclen’ for record length when you run IOzone and record lengths between 4KB and 16MB were tested here. This is why some of the graph shows as completely zero, some of the tested file sizes are not big enough for all record lengths tested, for instance it is not possible to have a 512KB file created from a 8MB record.
- MBps: This is the speed that a file of certain size and record size was written to or read from disk in Megabytes per second.
Windows and Linux NFS sequential write speed benchmark
First we will compare the sequential write speeds against each other.
As can be seen here, the Windows NFS server seems to ramp up in speed over time as the file size and record size get larger, the top speed of the largest files being slightly faster than the Linux NFS server. However the clear winner here is the Linux NFS server, which is sequentially writing much faster and more consistently overall on the smaller file sizes as well. The top speed on the Linux NFS server may be slightly slower than the Windows NFS server, however this seems to only be under that particular scenario of a large file size. For general overall use, NFS on Linux is performing better over a larger range of file sizes in terms of sequential write speed.
Windows and Linux NFS sequential read speed benchmark
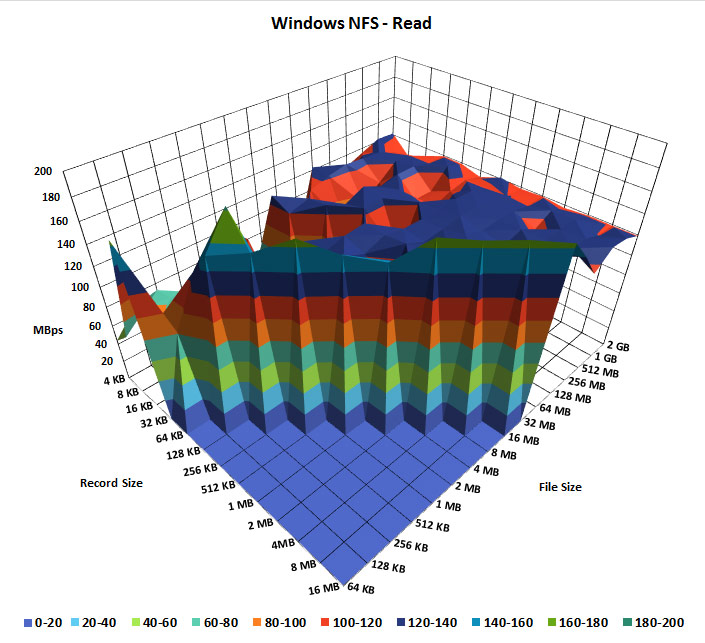
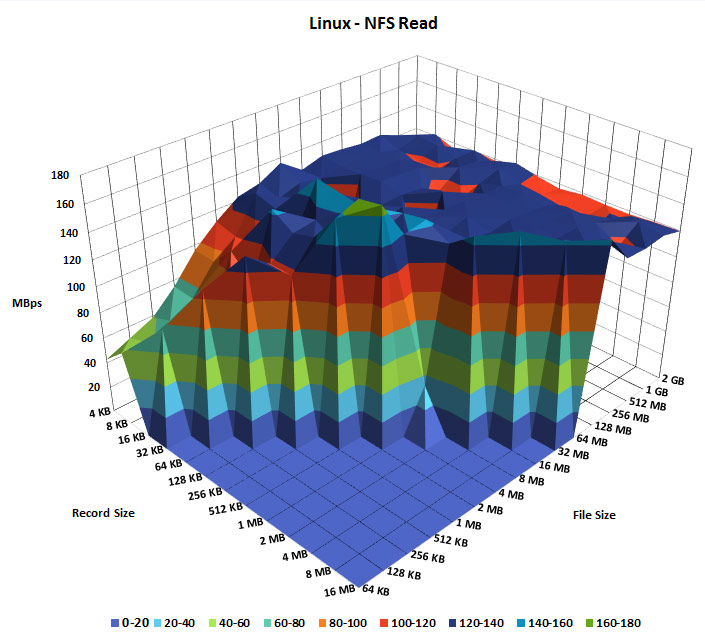
Once the files were written by IOzone the sequential read speeds were then tested.
These two read tests are fairly even, which is expected with read speed as this is typically faster than writing. The network bandwidth between the two servers was essentially topped out in the test environment during these tests which is why both of the above graphs show as being quite flat. What is interesting here is that despite them both completely saturating the network connection at times, there are far more dips in the Windows NFS server test, while the Linux NFS server in comparison is producing a more overall stable sequential read speed.
Windows and Linux NFS random write speed benchmark
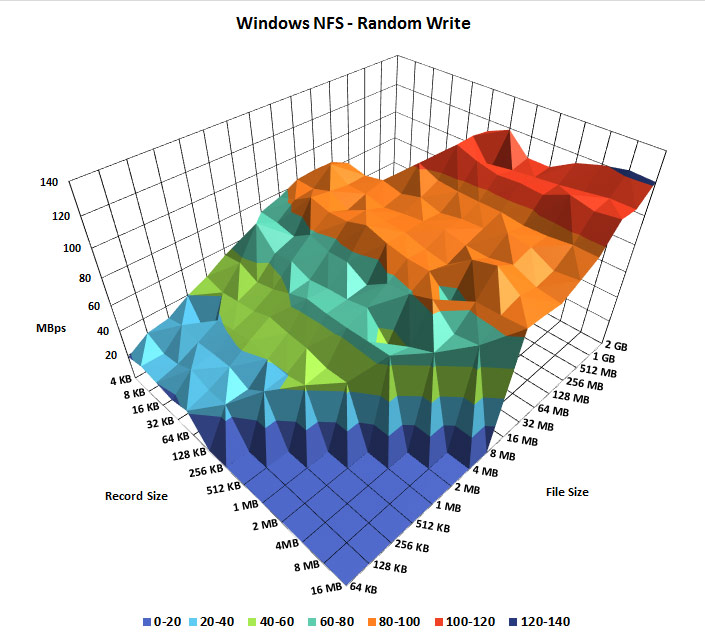
Next we will compare the random write speeds against each other.
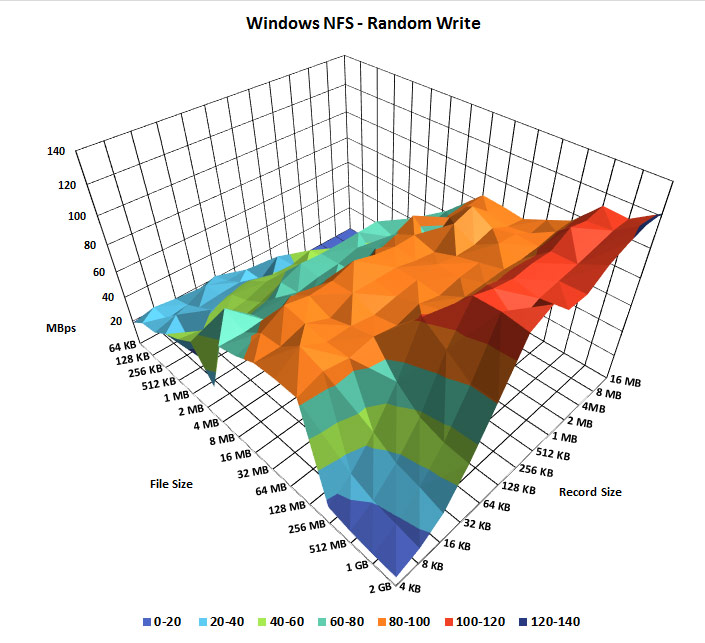
At first glance this looks pretty similar to the first Windows sequential write test, however this graph does not show the large file size with low record size as it dips down. To show this I have changed the perspective of the graph below, allowing us to see that the random write speed of large files with a low record size drops in performance.
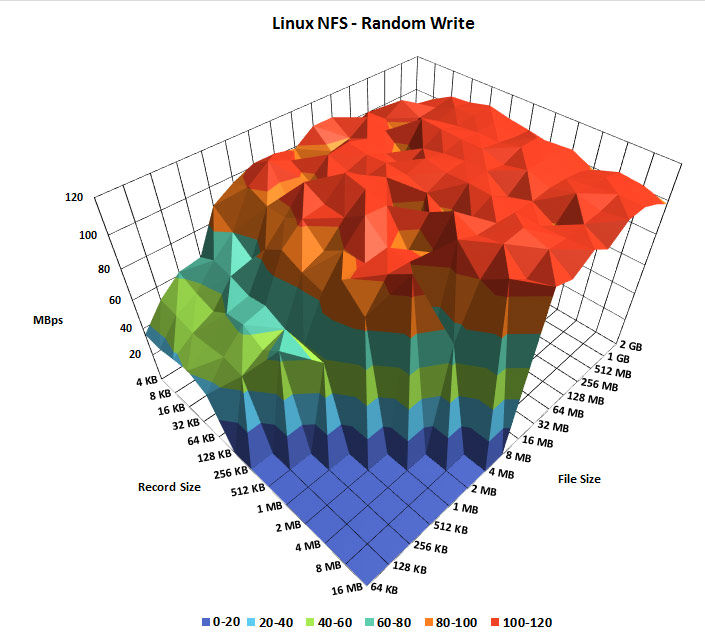
The Linux server on the other hand, again has a much more consistent higher speed overall.
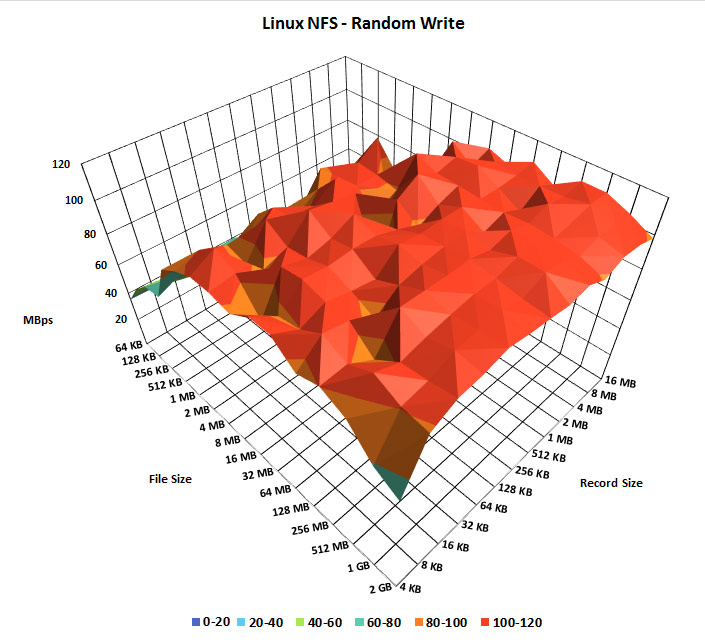
Below is the same graph with the perspective change that was done for the Windows graph for a fair comparison.
As shown above, the Linux random write test only dips down a small amount during large files with a low record size, which seems insignificant when compared to the same test performed on the Windows NFS server. From this we can see that the random write speed of large files with a small record size is significantly faster on the Linux NFS server, as well as overall write speeds. Windows random write speed was a little faster on the larger files with large record sizes compared to Linux however.
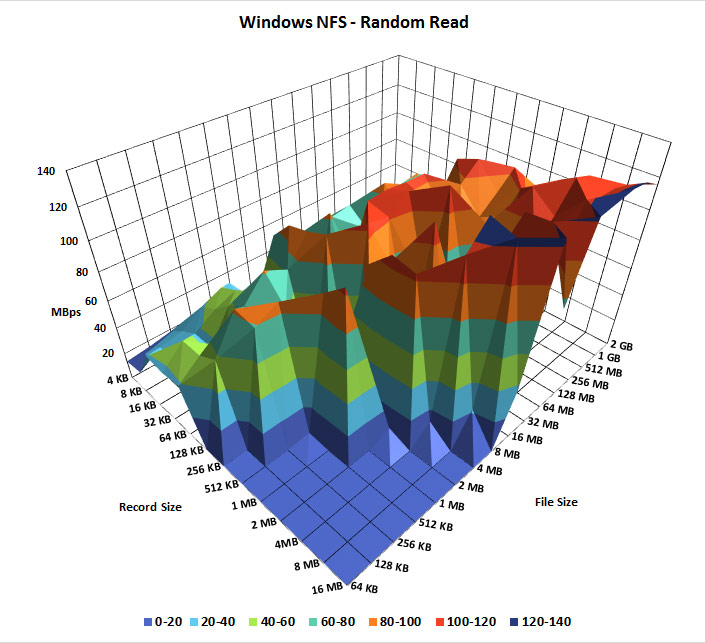
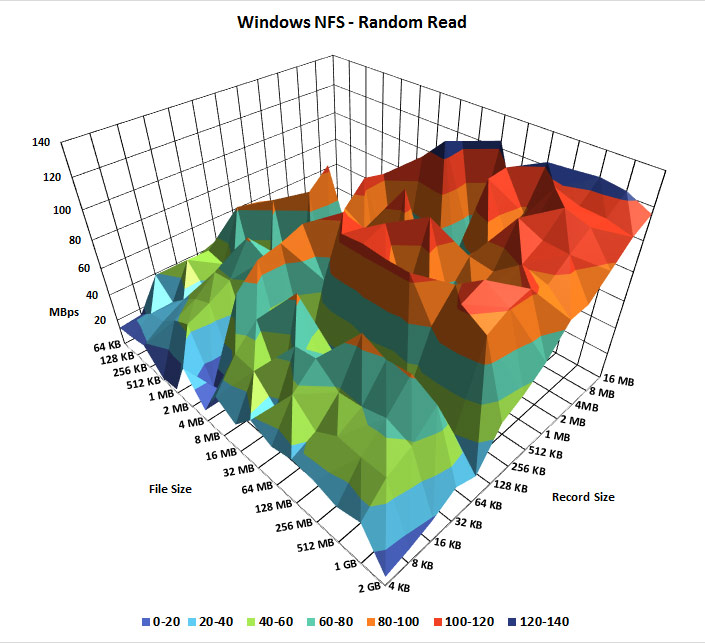
Windows and Linux NFS random read speed benchmark
Next we will compare the random read speeds against each other.
To adequately see the performance in this test I have included two graphs again so that all data can be seen from different perspectives.
As shown in the graphs above the random read performance of the Windows NFS server is all over the place, with a trend towards better performance with larger files and record sizes.
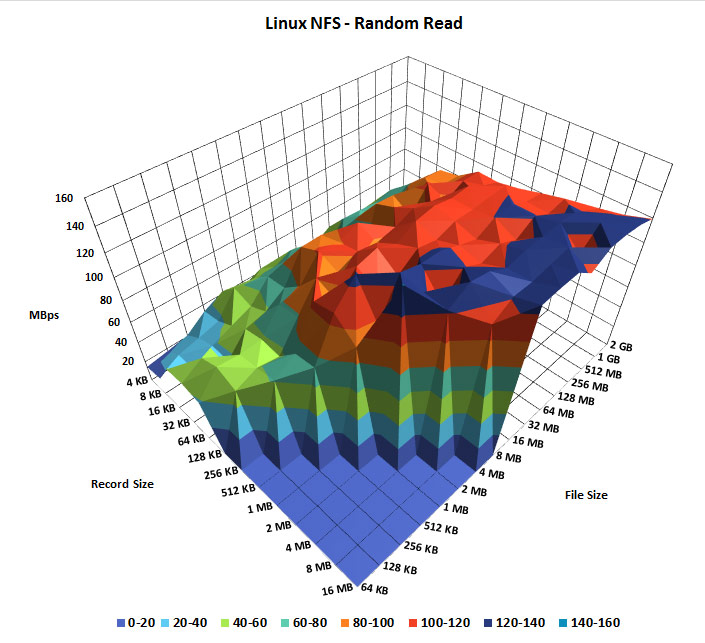
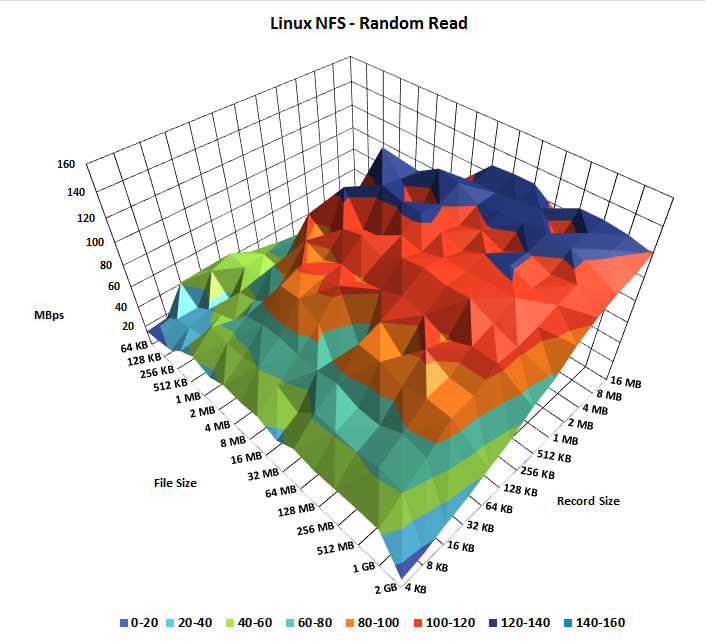
The Linux results on the other hand are much more consistent, as shown below.
For a fair comparison with Windows I have also provided a second graph of the same test so that all of the graph can be seen. The results here are much smoother indicating a more consistent result in performance as the file size and record size increases when compared to Windows. The Linux results also show faster maximum speeds this time.
Performance differences
The results made sense to me as I expected a UNIX based protocol to perform better on a UNIX based operating system. I did originally plan to also perform the same tests from a Windows client, however I had problems getting Windows to correctly mount the NFS version 4.1 mount from a Windows server so did not include those results, perhaps in a future post.
I proceeded to investigate possible reasons for the performance difference. From my research Microsoft implemented NFS 4.1 support in Windows Server 2012. However Windows does not seem to support Parallel NFS (pNFS), as mentioned in the previous link Microsoft state that the mandatory features of RFC 5661 for NFS version 4.1 are implemented, however as noted in RFC 5661 pNFS is optional. I was not able to confirm if this was implemented in 2012 R2, I am assuming that it is not as I could not find anything saying that it was present. As pNFS does offer performance improvements, I performed the same tests with IOzone against the NFS mount on the Linux server while mounting it as version 4.0, which does not make use of pNFS. The results were essentially the same, so despite Windows possibly not having pNFS it does not appear to be the reason for it performing worse during my testing.
CentOS on the other hand has had pNFS support since version 6.4 as part of NFS 4.1.
There may also be some difference between the performance of the file system on the actual disk, so in this case the differences between NTFS (windows-server) and XFS (linux-server).
Conclusion
As shown in our various tests, NFS on a Linux server consistently outperforms its Windows based counterpart in most of the read and write tests. During the sequential write tests the Windows NFS server did perform a little faster with larger files, however the Linux NFS servers sequential write speed was much more consistent and faster overall even at smaller file sizes. Under random writes the performance of the Windows server when handling large files with small record sizes dropped significantly when compared to the Linux server which barely dropped at all.
The sequential read tests of both servers were fairly similar as the network connection was maxed out, however this still revealed more performance dips in the Windows test compared to the Linux NFS server which remained much more consistent overall. The random read test of the Windows server was the worst of all results, while there is a trend showing larger files are read faster, the results clearly show that performance is all over the place. The graph for the Linux server in comparison was a smooth rise with many less dips in performance, as well as faster top speeds.
While some of the tests on the Windows NFS server did perform slightly faster with large file sizes, the overall results at a varying selection of file sizes varied much more and were slower when compared with the Linux NFS server. I would be interested in finding out why this is the case, from my observation it would seem that the only difference is the operating system and how each implements NFS version 4.1. The servers were running on the same hardware with the same resources, even when the network bandwidth reached the limit the way this was handled in Windows with the performance dips shows that Linux is the overall winner when it comes to raw NFS read and write performance.
In a Windows environment SMB/CIFS will likely be preferable and is the native option, while NFS is typically used in a UNIX based environment. This may be for many other reasons than the raw performance that has been tested here, such as various functionality aspects. Performance is definitely not the only factor, yet is an important one to consider if you are running a mixed operating system environment.
Despite the difference in performance shown here, it’s good to see that these different operating systems can work together to allow for file sharing with different protocols, whether it be by running NFS in Windows, or SMB/Samba in Linux.
Congrats, those are the most useless charts I have ever seen, perhaps going back to 2D might make this article actually useful?
Feel free to let me know how I can map three different axis of data in two dimensions.
You use a line graph with a line for either the file or record size then use the other as the X axis with the Y axis being the mbps.
The info is amazing, I am trying to do the same charts using python and the graph libraries.
THANK YOU!
Incredible article, thank you for your time
Sorry Barb if you cant comprehend 3D charts. The information was clear and easy to understand. Thank You Jarod this was helpful!
Incredibly useful article. Thank you very much. FWIW, the graphs were my favourite part. Ideal way to visualise these results.
Good to hear someone liked the graphs, seems like some people can’t understand them.