Following on from my recent Linux web server benchmarks, I’m going to be performing the same tests on all current generations of Microsoft’s IIS web server.
Here I’ll be performing benchmarks against the below versions of the IIS web server and then comparing them against each other to get an idea of which one performs the best under a static workload.
- Windows Server 2008 R2 – IIS 7.5
- Windows Server 2012 – IIS 8.0
- Windows Server 2012 R2 – IIS 8.5
- Windows Server 2016 – IIS 10.0
First I’ll discuss how the tests were set up and actually done before proceeding into the results.
The Benchmarking Software
Once again I made use of Weighttpd to perform the actual benchmark tests, as I’ve found that it works well and scales quite nicely with multiple threads.
I ran the benchmarking software in it’s own Linux based virtual machine. The problem with running weighttpd on the same server that is running the web server software, is that a significant amount of CPU resources end up being used by the test itself which are thereby taken away from the web server.
Weighttpd was run via the ab.c script, which essentially automates the testing process for me. Instead of running hundreds of weighttpd commands I use this script to step through different concurrency levels automatically.
weighttp -n 1000000 -c [0-1000 step:10 rounds:2] -t 8 -k "http://x.x.x.x:80/index.html"
Where -n is the number of requests, in this case we are sending 1,000,000 requests for every concurrency level of -c specified. Thanks to ab.c, we are able to step through from 0 simultaneous requests up to 1,000 in increments of 10 at a time. Each test is also performed 2 times as specified in the rounds, this way I am able to get a better average result as each concurrency level is run 2 times. In total every test at each core level therefore results in around 200,000,000 GET requests being sent to the web server at http://x.x.x.x:80/index.html. In total 3.2 billion GET requests were completed to determine the results below.
I would normally run the tests more times to get a better average, however as IIS was responding so quickly I had to increase from my usual 100,000 requests at each concurrency level to 1,000,000 in order to get proper numbers, so I’d therefore consider the results a rough average than a more exact reproducible result.
The -t flag specifies the amount of threads to use, this was adjusted from 1, 2, 4 and 8 depending on the amount of CPU cores assigned to the web server for each test. The -k flag is also specified as we are making use of keep alive.
The Test Environment
In order to perform the tests I made use of four Windows virtual machines that were running on top of VMware ESXi 5.5, so while an extremely small amount of additional performance could have been gained from running on bare metal, making use of virtual machines allowed me to easily modify the amount of CPU cores available when changing between the tests. I’m not trying to get the absolute best performance anyway, as long as each test is comparable to the others then it’s fine and I can adequately test what I am after.
The physical server itself that was running ESXi had two CPU sockets, each with an Intel Xeon L5639 CPU @ 2.13GHz (Turbo 2.7GHz), for a total of 12 CPU cores. The numbers provided in this post should only be compared here within this post rather than other benchmarks I’ve done previously, as everything here was run on the same hardware here.
All Windows virtual machines were assigned 4GB of RAM and were using the same SSD’s for storage. The amount of CPU cores on these were adjusted to 1, 2, 4 and then 8 for each test. Only one Windows virtual machine was running at a time during the testing. All Windows servers had all available Windows updates to date installed.
Web Server Configuration
It is important to note that these web servers were only serving a static workload, which was an 8 byte index.html page containing the string “Testing.”. The goal of this test was to get an idea of how the different versions of IIS performed with raw speed by serving out the same file. I would be interested in doing further testing in the future for dynamic content such as ASP/PHP, let me know if you’d be interested in seeing this.
Otherwise all IIS settings were left completely default, no changes were made to IIS configuration itself.
Server Configuration
No changes were made to the Windows operating system for these tests. All servers were fully up to date with all available Windows updates installed. Windows Datacenter edition with a GUI was used for all tests.
Benchmark Results
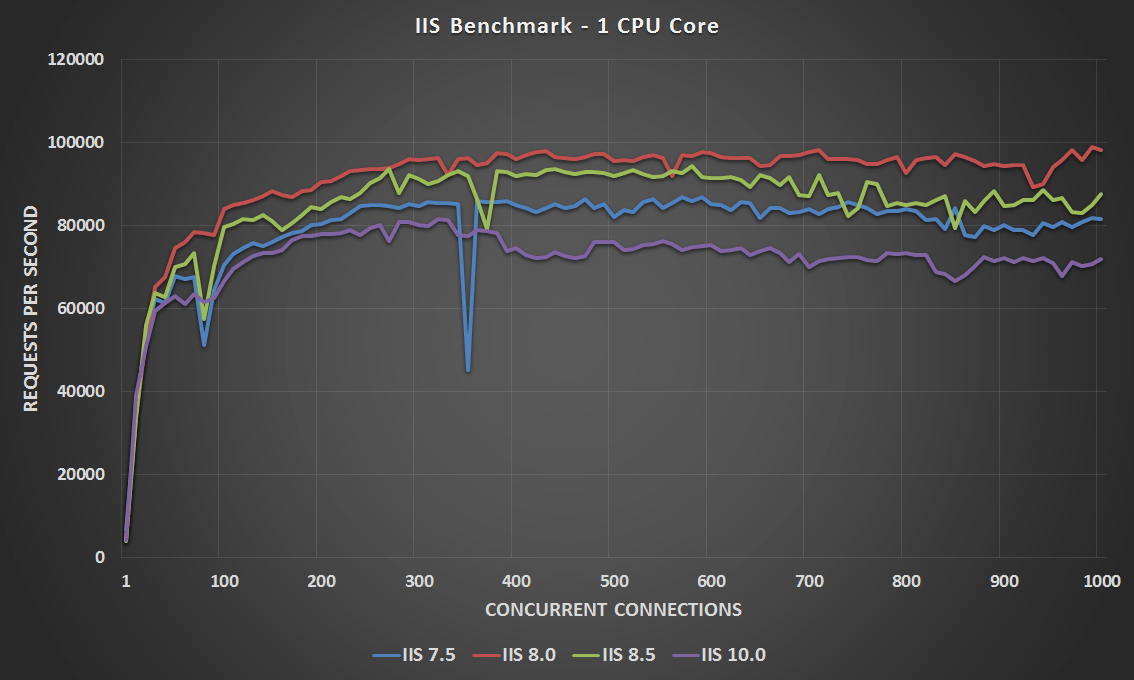
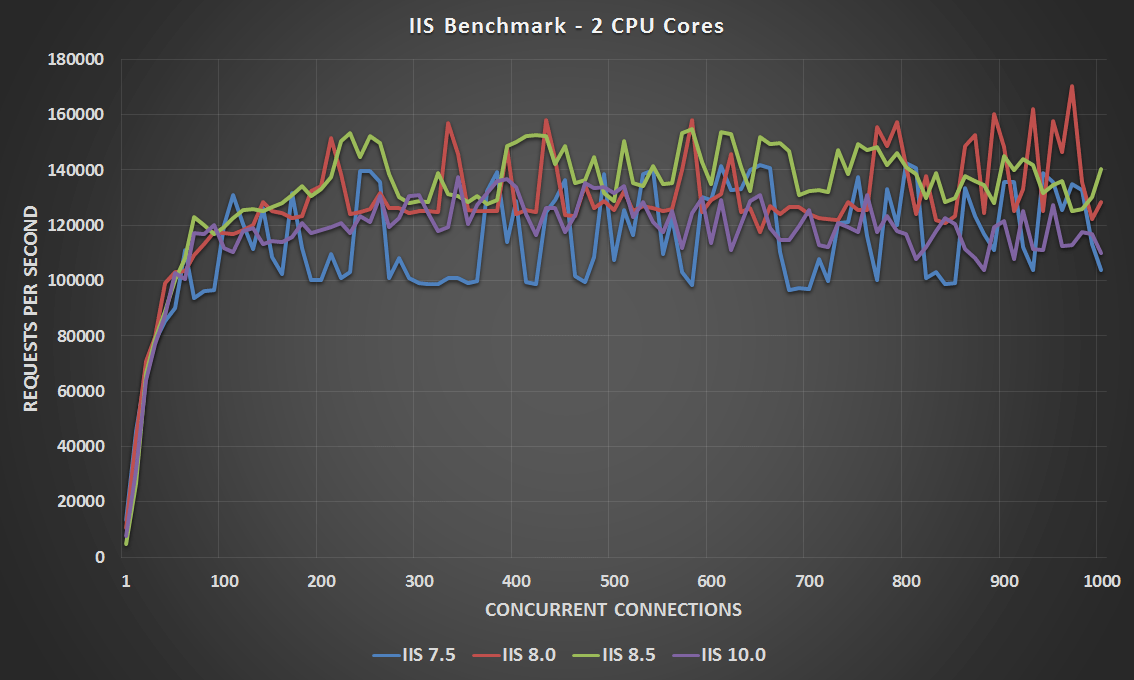
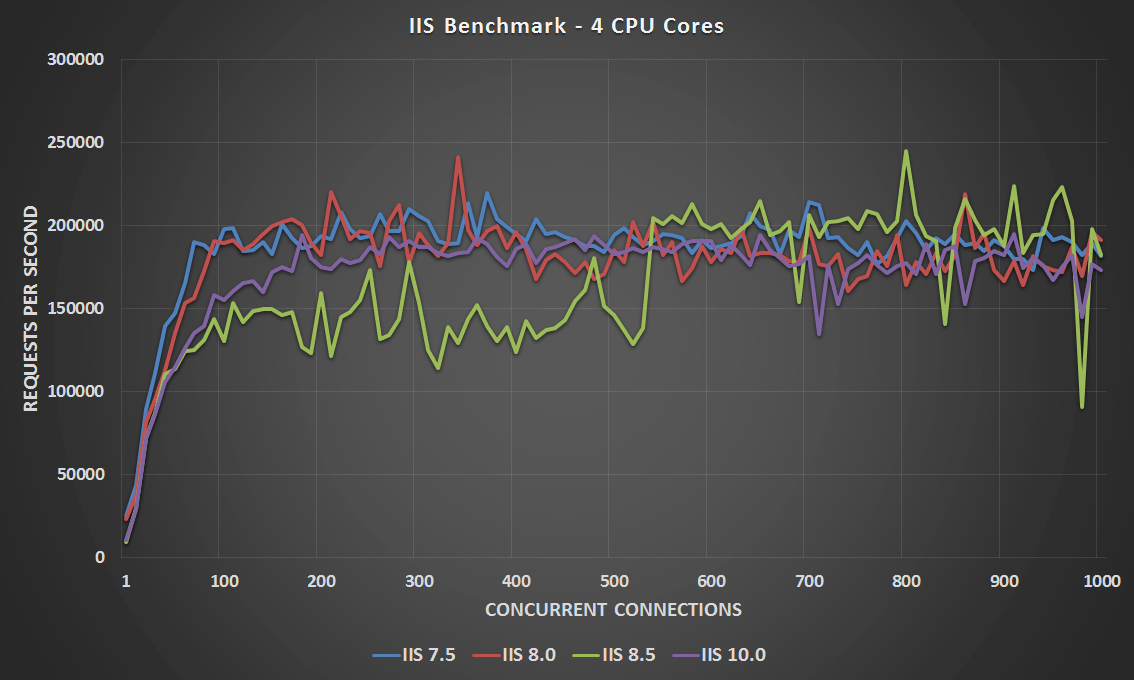
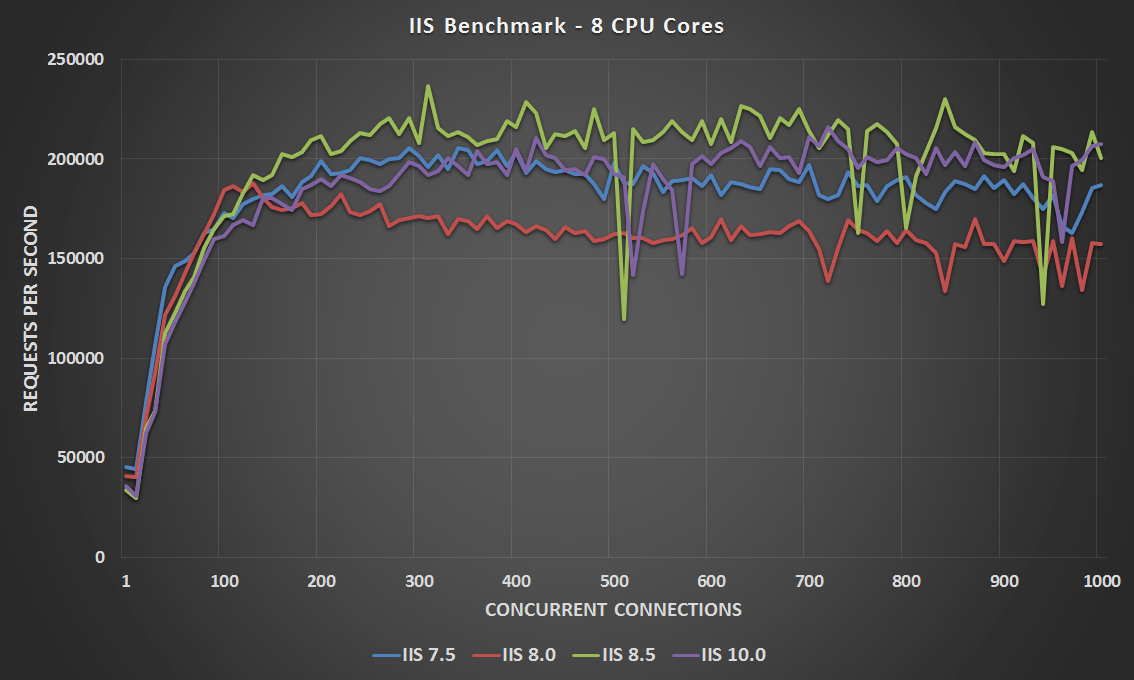
Now that all of that has been explained, here are the results of my benchmark tests as graphs.
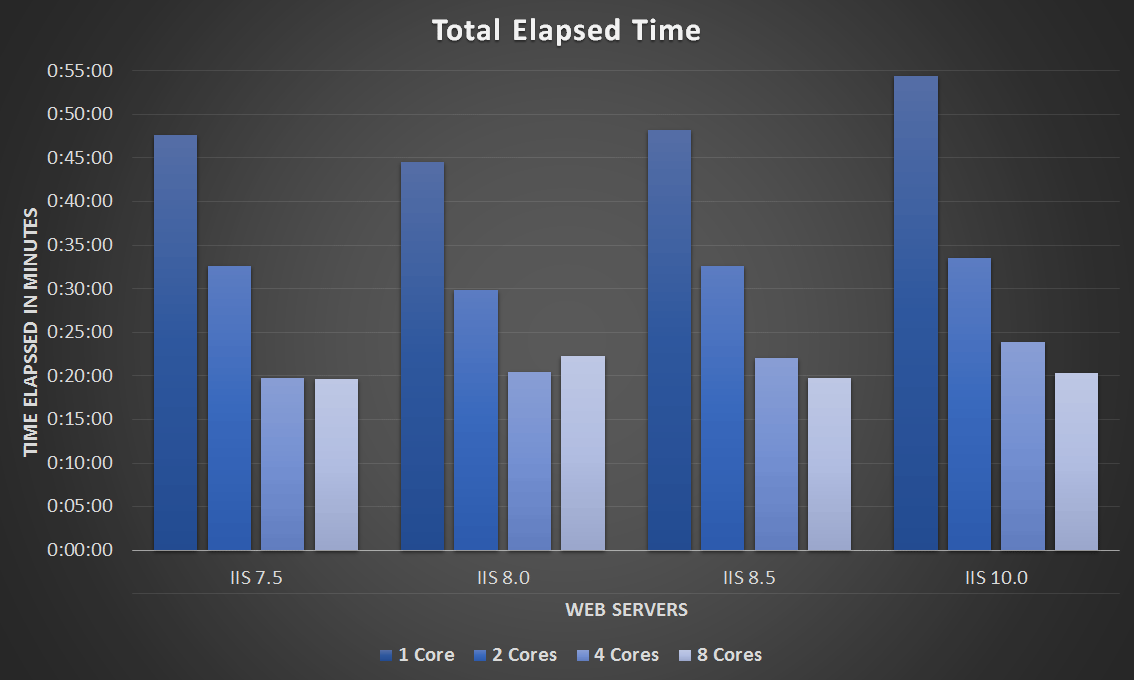
Total Time Taken
This final graph simply displays how long the tests took to complete in the format of hours:minutes:seconds. Keep in mind as mentioned previously each test will result in approximately 200,000,000 GET requests for the index.html page.
Conclusion
The results are definitely not what I expected. I actually re-ran some of the tests to confirm the results were accurate. In general, I assumed that newer versions of the Windows operating system and IIS would perform better, however this does not strictly appear to be the case as you can see. It’s also not the case that newer versions are always worse off either, when I saw the IIS 10.0 results my first thought was maybe either the OS or IIS itself had increased functionality somewhere that came at a performance cost.
If anything, we can see that at least newer versions of IIS (8.5 and 10.0) appear more scaleable out of the box with increased CPU core counts, as evidenced in the total elapsed time graph. While we can see diminishing returns in how quickly the test takes to complete, the differences between the 4 and 8 core tests are still different. The IIS 7.5 and 8.0 tests for comparison were close to the same and then worse off at the higher core count respectively. A core count of 4 seems to be the sweet spot here for best performance with IIS in a static workload with default out of the box settings, of course this may change with further tweaking of the configuration.
Also interestingly IIS appears to have beaten all Linux based web servers that I tested last year. So even if the results here don’t make the most amount of sense, it was very interesting that in this specific static workload test that the Windows web servers came out ahead in terms of raw requests per second.
Windows Server 2016 is the first windows server to include built in antivirus, if you left it enabled, this is probably why it was slower.
I don’t see why AV would do anything to each individual GET request to the web server, you’re reading data out through an unchanged static file, that would be extremely wasteful and I hope and assume that Microsoft are smarter than that. Regardless I have uninstalled Windows defender and run the tests again, the results are actually slightly worse, though I suspect that’s just luck and doubt Defender had much to do with it.
It seems defender does impact IIS: https://forums.iis.net/t/1233774.aspx?Certain+Classic+ASP+pages+extremely+slow+on+IIS+10
Try with this:
for dummy=0 to 5000
execute(“dummy2=1”)
next
On IIS 7.5 execution time is 0, on IIS 10.0 it is over 20 seconds!!!
thanks for your time to write this article. this helped me a lot. I could not find any compared performance metrics for different IIS versions.
Hi Jarrod,
I was wondering if you could tell me the software you used to generate the line graphs from your results?
Thanks
I use Microsoft’s Excel to do all of my graphs.
Thanks mate!
That’s handy because I have excel here. Great post btw, even if I am late to the party. Doing some testing for a university class and this gave me some inspiration!
No problem at all! Hope it goes well :)
Hi,
The -C option is working in powershell. How do I use ab.c script in widows