Here I will share a few useful Linux commands I have been using to troubleshoot various server problems. Logging is extremely useful especially when an issue happens at random times or you are not able to yet reproduce the problem. Going back over logs to when a problem was identified will provide you with information and insight into what caused the problem and the general state of the server during that time period, this is why I am covering how to perform logging with these useful commands. There are plenty of other useful commands that are useful for more specific troubleshooting, however I have found these ones the best overall for identifying issues.
The below commands can be run as is through the server console, SSH session, as cron jobs, or in the background by appending a & to the command in most cases.
Logging system resources with dstat
Dstat allows you to see all system resources and compare them against each other, this is very useful for seeing what is happening to the resources on a server, if a particular resource has run out for example it can cause performance problems.
To use dstat you will first need to install it, if you do not already have it.
Debian/Ubuntu
apt-get install dstat
Red Hat/CentOS
yum install dstat
Once dstat is installed, you can run it by just simply typing ‘dstat’ at the command line. By default it will show you CPU usage, disk read and writes, total network traffic in and out, paging and system stats consisting of interrupts and context switches.
This is essentially running dstat with -cdngy as this is what happens by default when you run ‘dstat’ alone. This will output information for each variable to the screen every second. There are a lot of things you can monitor with dstat, you can check all these out on the man page which is definitely worth a look at.
Below is the dstat command I use to log system resource usage while troubleshooting, I use it to try and get as much information as possible on the amount of system resources in use.
dstat -tcdrgilmns --output /var/log/dstat.csv --noupdate 5
This will run dstat with -tcdrgilmns, below is what each option does – see the man page for full information as there are many more options, use the ones you need.
- -t: Time – enables timestamps on the logs, very useful when logging at logs later
- -c: CPU stats (system, user, idle, wait, hardware interrupt, software interrupt)
- -d: Disk stats (read, write)
- -r: I/O request stats (read, write)
- -g: Page stats (page in, page out)
- -i: Interrupt stats
- -l: Load stats (1 minute average, 5 minute average, 15 minute average)
- -m: Memory stats (used, buffers, cache, free)
- -n: Network stats (received, sent)
- -s: Swap stats (used, free)
Below is an example of this running for 5 seconds which should outline the useful information recorded. This is dstat outputting the information to the console, the data will be the same format when in the .csv however.

This image is quite long, click for enlarged version.
--output is specifying that the output will be logged to /var/log/dstat.csv
--noupdate will mean that dstat will not refresh until 5 seconds have passed, otherwise dstat will still actually refresh every 1 second, it just wont be written to the log file. 5 also means that the result of the dstat query will be logged every 5 seconds, you can change this to suit your needs however generally I find that logging system resources every 5 seconds is plenty.
The output of dstat is a .csv file, you can open it as a spreadsheet and view the recorded data easily, making dstat a great overall tool for analysis.
An example of its use can be seen in this example, if I am having an issue with something loading slow and see that memory is all in use, disk reads and writes have increased and paging has increased it would tell me that something is using all the RAM and the server has had to start swapping to disk. Based on these logs I would then start to look into what is causing the I/O to disk to identify the primary cause – more on that next.
Logging disk I/O with iotop
The iotop command is used to watch disk input/output (I/O) usage by processes or threads in a top-like monitor, by showing the processes that are using the most disk I/O reads and writes first.
To use iotop you will first need to install it if you do not already have it. You will also need Python 2.5 or higher, as well as kernel version of 2.6.20 or higher.
Debian/Ubuntu
apt-get install iotop
Red Hat/CentOS
yum install iotop
You can check the version of Python installed like this. As you can see my test server is above 2.5
python -V
Python 2.6.6
You can check the kernel version with the uname command. As you can see my test server is above 2.6.20
uname -r
2.6.32-5-amd64
Once iotop is installed, you can run it by just simply typing ‘iotop’ at the command line. By default it will show you the total disk read and writes as well as the top processes using I/O.
Below is the iotop command I use to log disk I/O usage while troubleshooting, it is useful for identifying disk bottlenecks and processes which are using too much disk resources instead of RAM.
iotop -to -d 5 > /var/log/iotop.txt
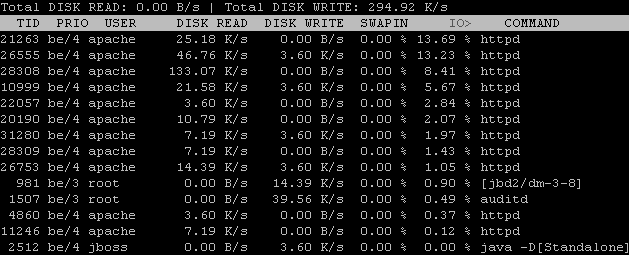
This will basically log the contents of iotop to /var/log/iotop.txt every 5 seconds as defined by -d, -t is used to add a timestamp to each line so that when we view the log file later we can see when events happened, -o is used to only show processes or threads actually doing I/O otherwise the log will get extremely large showing the processes that idle for disk use.

The above image is of iotop running on a web server, you can see Apache is using some I/O for disk writes currently.
Identifying high I/O may not however be your problem, continuing the previous example if we are seeing high disk usage from swapping it may be a result of some process requiring a lot of memory rather than the process itself accessing disk for reads or writes. The message here is that the high I/O may not necessarily be the root cause, we can get a further idea on what processes are using CPU and memory resources next up, with top.
Logging processes with top
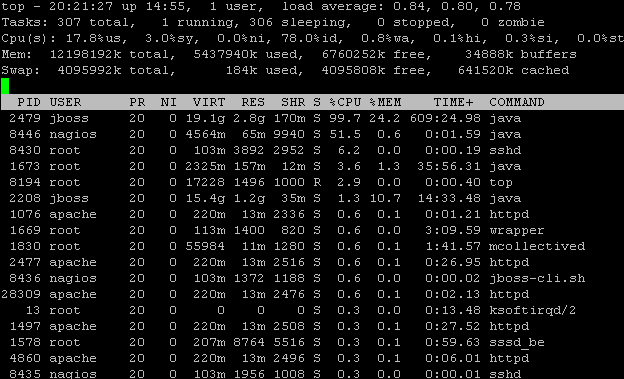
The top command is a common one used to provide a detailed real time view of a running system, it displays summary information on system resources as well as a process list along with the resources each process is using. Top is very useful for identifying issues, and we log top to disk like this.
top -d 5 -b > /var/log/top.txt
This command will run top every 5 seconds as defined by -d, -b is for batch mode and this is used for sending output to a file, note that there will be a lot of output so you may not want to log this too frequently unless you are compressing the log files, more on this in the next section below.

If your logs indicate a process is using more resources than you expect then you now have something to go on to investigate further. For example in the above image I may want to find out what Java is doing to require so much CPU, unfortunately this is normal operation in this situation.
Managing the log files with logrotate
If you are going to run logging for an extended period of time you will want to set up logrotate. This can be used to ensure you only keep a certain amount of logs, for example all logs for the last day, week, or month – what ever period you like. You can also have logs compress with gzip when they are rotated which is useful because some of the above logs, like top, log a lot of information and if you are doing this every few seconds you can easily use a couple of gb per day in logs, gzipping reduces the file size immensely allowing you to log for longer without eating disk space.
You can apply this to other log files as well, in this example I will be gzipping my top.txt file from the top logging every day and keeping the last 7 days worth of logs.
I created a new file in /etc/logrotate.d/ called top, so we have /etc/logrotate.d/top used to rotate /var/log/top.txt and it contains the following.
/var/log/top.txt {
daily
rotate 7
create
copytruncate
compress
}- Daily – Log files are rotated every day.
- Rotate – Log files are rotated the amount of times specified before being removed. In this case we keep 7 days worth of logs because daily is set.
- Create – Immediately after rotation the log file is created with the same name as the log file just rotated.
- Copytruncate – truncate the original log file in place after creating a copy, instead of moving the old log file and optionally creating a new one, it can be used when some program can not be told to close its log file and thus might continue writing to the previous log file. This is just done to ensure that the logs rotate correctly, you can leave it out if you like.
- Compress – old versions of log files are compressed with gzip by default. This is a must for large log files like top.
For further information on logrotate, see the man page as all these details and more are there.
Summary
Throughout this post I have covered the use of dstat, iotop and top commands as well as how to log each to a file on disk for reviewing later. Dstat is a great tool for providing a general overview of all system resources, iotop is useful for showing where disk I/O is being used, while top shows a list of processes and the resources they are using. While these tools are useful on their own, enabling logging for them is extremely useful when you are trying to diagnose a problem that you have not yet been able to catch in the act or replicate, as you can go back and consult the logs to determine exactly what has been happening in the past.
What are some of your useful Linux commands for logging issues?
Very useful post! Thank you. However, I require to do this every couple of minutes and I have tools like SeaLion which does all this by default, and also shows me the output of these commands on a great UI with a timeline.
Actually, some of us are in restricted environments where loading additional software packages is not allowed. Such as hardened systems and true appliances running linux. I appreciate the commands, I would add strace -p (for pid stracing).
It is an excellent way to debug a nasty process or an overloaded service that mya perhaps have file permission bogging it down, etc.
Thanks!