Thruk acts as a central web interface allowing you to monitor multiple backends such as Naemon, Nagios, Icinga and Shinken via the Livestatus API. I had some difficulty getting it connecting to my back end servers so here are the steps I took to get it done. By the end of this guide you should be able to add your back end monitoring servers into Thruk, we’ll cover adding an Icinga server in this instance however the steps will be very similar for a Nagios server, given Icinga is a Nagios port.
In this example I have two servers as below:
- Thruk – 192.168.0.10: This server has Thruk installed, it will centralize our monitoring by collecting information from the Icinga server.
- Icinga – 192.168.0.20: This server has Icinga installed which is a port of Nagios, it is what does the actual monitoring of our hosts. This is where Livestatus is installed.
We could have many more backend servers running other monitoring systems such as Nagios, they would be added in the same manner.
Installing Livestatus on the backend
Livestatus makes use of the Nagios event broker API by opening up a socket whereby data can be retrieved on demand, in this case by Thruk. This is preferable as we can just query the back end servers and retrieve status information from them, rather than duplicating any configuration or checks.
You can install Livestatus from source, or from a repository, in this example we’ll be using the Consol* Labs Repository for ease of use. This is the repository the Thruk documentation suggests using for both installing Thruk on your Thruk server, and Livestatus on your monitoring backend servers.
https://labs.consol.de/repo/stable/
In my case the Icinga monitoring server is running CentOS 6, so I run the following command to set up the repository as per the above link.
rpm -Uvh "https://labs.consol.de/repo/stable/rhel6/i386/labs-consol-stable.rhel6.noarch.rpm"
Once that’s completed install Livestatus onto the back end monitoring server.
yum install mk-livestatus -y
Configurating Livestatus on the back end
Now that Livestatus has been installed we need to configure it to accept connections from the Thruk server.
In /etc/icinga/icinga.cfg we specify a broker_module as below:
broker_module=/usr/lib64/mk-livestatus/livestatus.o /etc/icinga/live
The location of livestatus may differ depending on your version / Linux distribution, if the above one does not exist also check /usr/local/lib/mk-livestatus/livestatus.o, otherwise check the documentation. The socket file does not have to be created in /etc/icinga/ either, you should be able to place this anywhere so long as the Icinga user can write to it.
Upon restarting Icinga, the /etc/icinga/live socket file should be created however it did not create, checking the /var/log/icinga/icinga.log file I noticed the following:
[1421809815] livestatus: Unable to bind adress /etc/icinga/live to UNIX socket: Permission denied
[1421809815] Error: Function nebmodule_init() in module '/usr/lib64/mk-livestatus/livestatus.o' returned an error.  Module will be unloaded.
I found the /etc/icinga directory needed the permissions changed so that this file can be written to by the Icinga user, so I’ve set it to 757 as below so that the icinga user can read, write and execute as required.
chmod 757 /etc/icinga/
Once this is configured, restart or reload the Icinga service.
/etc/init.d/icinga restart
Now you want to check the logs to confirm that Livestatus is working without any problems, see the /var/log/icinga/icinga.log file after performing the restart of the service, ideally if everything is working fine you’ll have some output similar to the below.
livestatus: Finished initialization. Further log messages go to /var/log/icinga/livestatus.log
Event broker module '/usr/lib64/mk-livestatus/livestatus.o' initialized successfully.
Now you may notice that Livestatus is not yet listening on TCP port 6557, this is a xinetd service with the configuration specified within /etc/xinetd.d/livestatus
You will need to modify this file a bit, below are the modifications that I put in place in the last few lines.
    user        = icinga
    server      = /usr/bin/unixcat
    server_args = /etc/icinga/live
Everything else should be fine to leave as default. Basically we’re using unixcat and xinetd to bind the socket of Livestatus to a TCP socket, where unixcat is installed with the Livestatus package and the /etc/icinga/live file is the socket file created by Icinga previously.
In order to apply this configuration change, you will need to restart xinetd. The interesting thing I found here is that this was not installed in my default CentOS installation so I was not able to complete this without first installing it as below.
yum install xinetd -y
Once that’s installed, or if you already had it, you can restart it as below.
/etc/init.d/xinetd restart
Now check that the back end server is listening on port 6557 with netstat, if it is you should see xinetd as listening on this port similar to the below output.
[root@Icinga ~]# netstat -antp | grep 6557

tcp        0      0 :::6557                     :::*                        LISTEN      29071/xinetd
Firewall allow rules
Next we need to actually allow the traffic through so that Thruk can query the back end server, the back end server is running iptables by default so we add the below line into /etc/sysconfig/iptables with our favourite text editor, replace the IP address with the IP address of your Thruk server.
-A INPUT -s 192.168.0.10/32 -p tcp --dport 6557 -j ACCEPT
Save the file, then restart iptables as below so that it’s up to date.
/etc/init.d/iptables restart
You can confirm the rule is active by running an “iptables -L -v” and confirming port 6557 is present in the output as ACCEPT from the IP you have specified.
[root@icinga ~]# iptables -L -v
Chain INPUT (policy ACCEPT 0 packets, 0 bytes)
 pkts bytes target     prot opt in     out     source               destination
  211 12660 ACCEPT     tcp  --  any    any     192.168.0.10       anywhere            tcp dpt:6557
If you have any other sort of firewall between the Thruk server and your back end servers you will also need to allow TCP port 6557 through there as well.
Adding the back end to Thruk
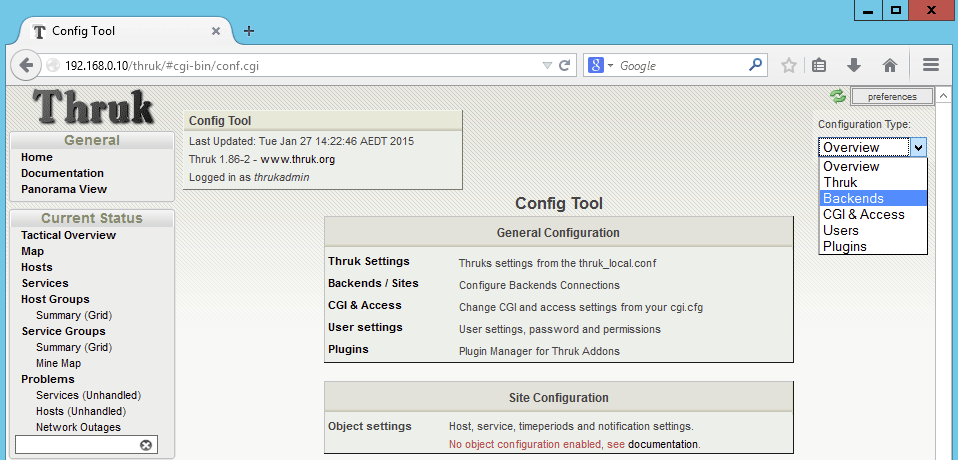
Now that the back end server has been prepared we can add it into Thruk via the web interface. In the left hand side System menu select Config Tool, then from the top right hand side change the Configuration Type drop down to Backends, here we can specify our back end monitoring servers to connect to.
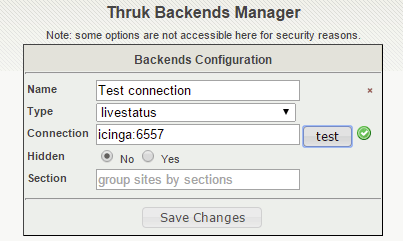
Simply enter a name to identify the monitoring server with, leave the type drop down as livestatus, and set the connection field to servername:6557, noting that servername must resolve to an IP address. You can either add the servername to the /etc/hosts file on the Thruk server itself if there is no resolvable DNS, or just use the IP address instead of the servername however this may be more difficult when you need to recognize which back end is which.
Once you have filled out the Backends Configuration, click the test button to confirm the connection. If it works a green tick will appear next to the test button, if it fails you will receive some other form of error message that you’ll need to troubleshoot. Things to check for would be that the back end server is actually listening on port 6557, from the Thruk server you can test this with a ‘telnet backend-hostname 6557’. Once the connection tests ok, click the Save Changes button toward the bottom.
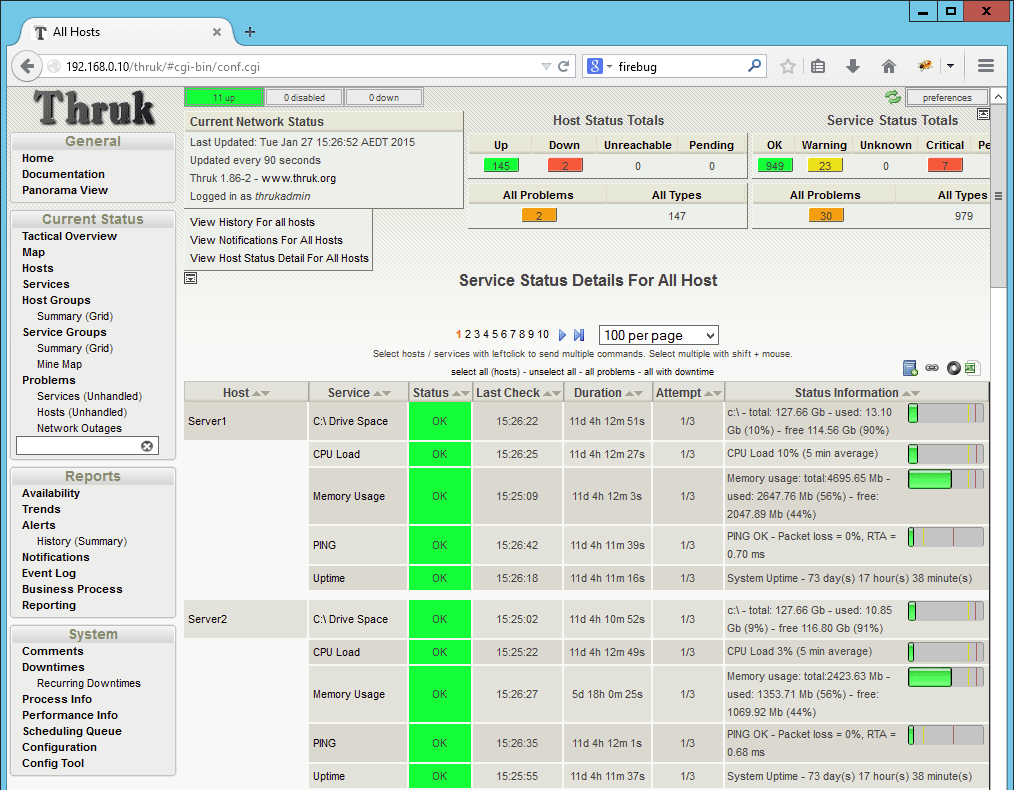
After saving the changes you should be directed back to the backends manager page, you can now instead view the hosts/services from the menu and see the same hosts and services being monitored from the back end server.
Useful links
There is extensive information on Livestatus here should you have any problems setting it up: https://mathias-kettner.de/checkmk_livestatus.html
Summary
By using Thruk we are able to add our back end monitoring servers into one central location. By consolidating the multiple monitoring servers we can simply view a single page to get an overview of the status of our network, hosts and services very quickly and easily.


Excellent walkthrough, really useful and spot on.
thanks so much for taking the time to lay this out
two thumbs up!
Charlie
Hey Charlie,
Thanks! Glad to hear that it’s been useful. :)
hi jarrod,
i had installed thruk on a centos7 box(already running icinga 1.10) using labs_consol_stable yum repository and installed mk-livestatus from source, and configure broker_module
broker_module=/usr/local/lib/mk-livestatus/livestatus.o /etc/icinga/live
I also setup the xinetd to listen to 6557
but when i go to /thruk url it shows “You are not authorized.It seems like you are notauthorized.” warning directly without authentication form .Any clue where i missed?
It’s been a while since I’ve used this, I do remember using a custom account and I had to add it to a few places in the configuration file. Do the logs show any further information when you get that error on the page?