The Google Capture The Flag (CTF) was run on the 29th and 30th of April 2016, this is my solution to the forensics challenge “For2” which was worth 200 points.
In this challenge the file capture.pcapng was provided with no other instructions other than to find the flag.
The original file can be found here if you want to follow along: https://rootusers.com/wp-content/uploads/2016/05/capture.pcapng
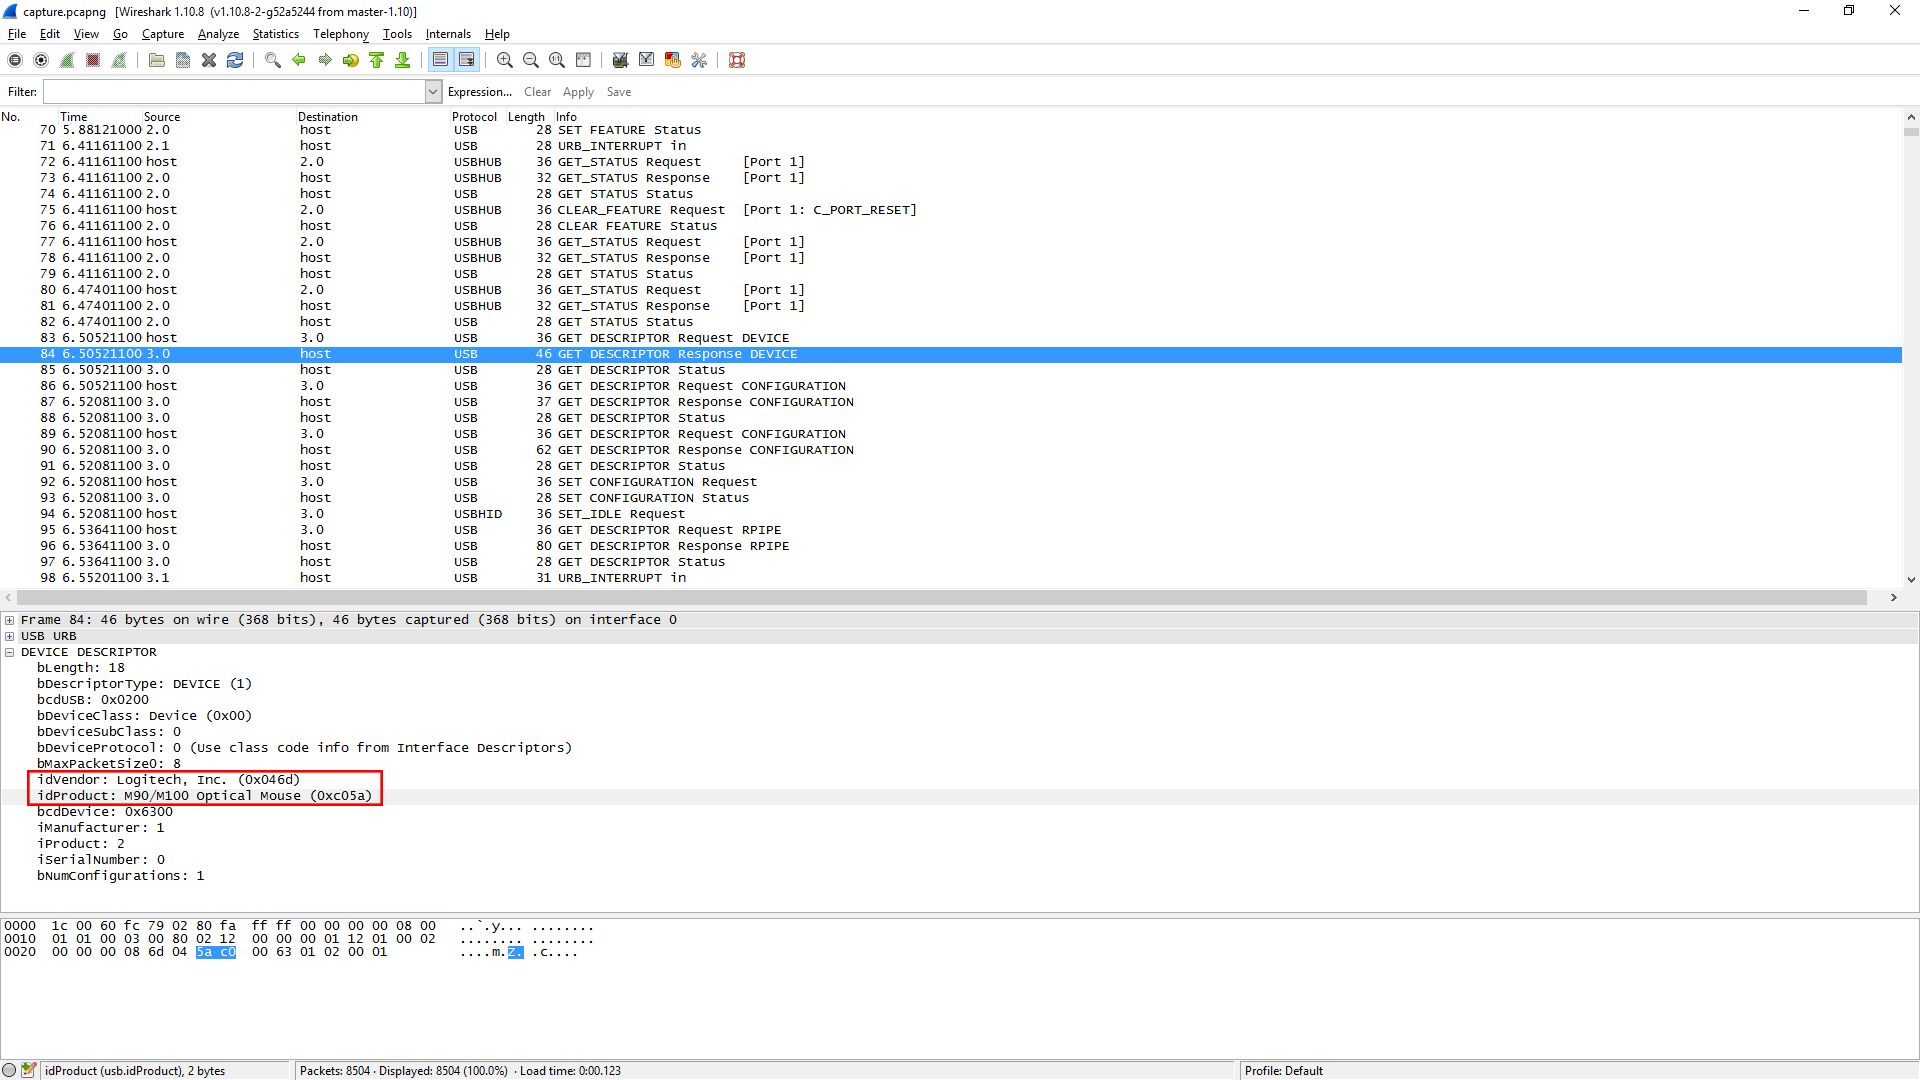
After opening the file in Wireshark, it looked like a USB capture. The majority of the file shows “URB_INTERRUPT in” from the source of 3.1, upon checking the first instance of source 3.0 appearing we can see that it appears to be a Logitech Optical Mouse, as shown below.
I noticed that the only field changing other than the IRP ID, was the Leftover Capture Data field, which appeared to be a 4 byte hex string. After some research I found that this represents mouse movement. This makes sense as the value is continually changing. The second byte measures the X movement, while the third byte measures the Y movement between +255 and -256 values.
Working on the assumption that these values are indeed mouse movements, I export this data with tshark as shown below.
what@kali:/tmp$ tshark -r capture.pcapng -T fields -e usb.capdata > data2.txt
what@kali:/tmp$ tail -n 20 data.txt
00:ff:00:00
00:ff:00:00
00:ff:00:00
00:fd:00:00
00:ff:00:00
00:ff:00:00
00:fe:ff:00
00:fd:00:00
00:fb:00:00
00:fc:00:00
00:fb:00:00
00:fc:00:00
00:fc:ff:00
00:fe:00:00
00:fe:ff:00
00:fe:00:00
00:ff:00:00
00:fe:ff:00
00:ff:ff:00
01:00:00:00
From here we need to turn the second and third bytes into coordinates. I found one instance of this being done before here, and made use of their awk command.
awk -F: 'function comp(v){if(v>127)v-=256;return v}{x+=comp(strtonum("0x"$2));y+=comp(strtonum("0x"$3))}$1=="01"{print x,y}' data2.txt > data3.txt
As shown this has correctly created my coordinates, the full file is 3167 lines long at this point which should give us this many points to plot.
root@kali:~# awk -F: 'function comp(v){if(v>127)v-=256;return v}{x+=comp(strtonum("0x"$2));y+=comp(strtonum("0x"$3))}$1=="01"{print x,y}' data.txt > data3.txt
root@kali:~# tail -n 20 data3.txt
-49 96
-47 98
-47 99
-46 101
-45 101
-43 100
-42 100
-41 100
-40 99
-39 98
-38 98
-37 97
-37 96
-37 95
-38 94
-39 93
-40 92
-41 92
293 -417
-576 -370
I’ll also note that you need to install the ‘gawk’ package in Kali if you with to use ‘strtonum’, otherwise you’ll receive the error “awk: line 2: function strtonum never defined”.
From here we simply plot the data into Gnuplot.
root@kali:~# gnuplot

	G N U P L O T
	Version 4.6 patchlevel 6    last modified September 2014
	Build System: Linux x86_64

	Copyright (C) 1986-1993, 1998, 2004, 2007-2014
	Thomas Williams, Colin Kelley and many others

	gnuplot home:     http://www.gnuplot.info
	faq, bugs, etc:   type "help FAQ"
	immediate help:   type "help"  (plot window: hit 'h')

Terminal type set to 'qt'
gnuplot> plot "data3.txt"
gnuplot>
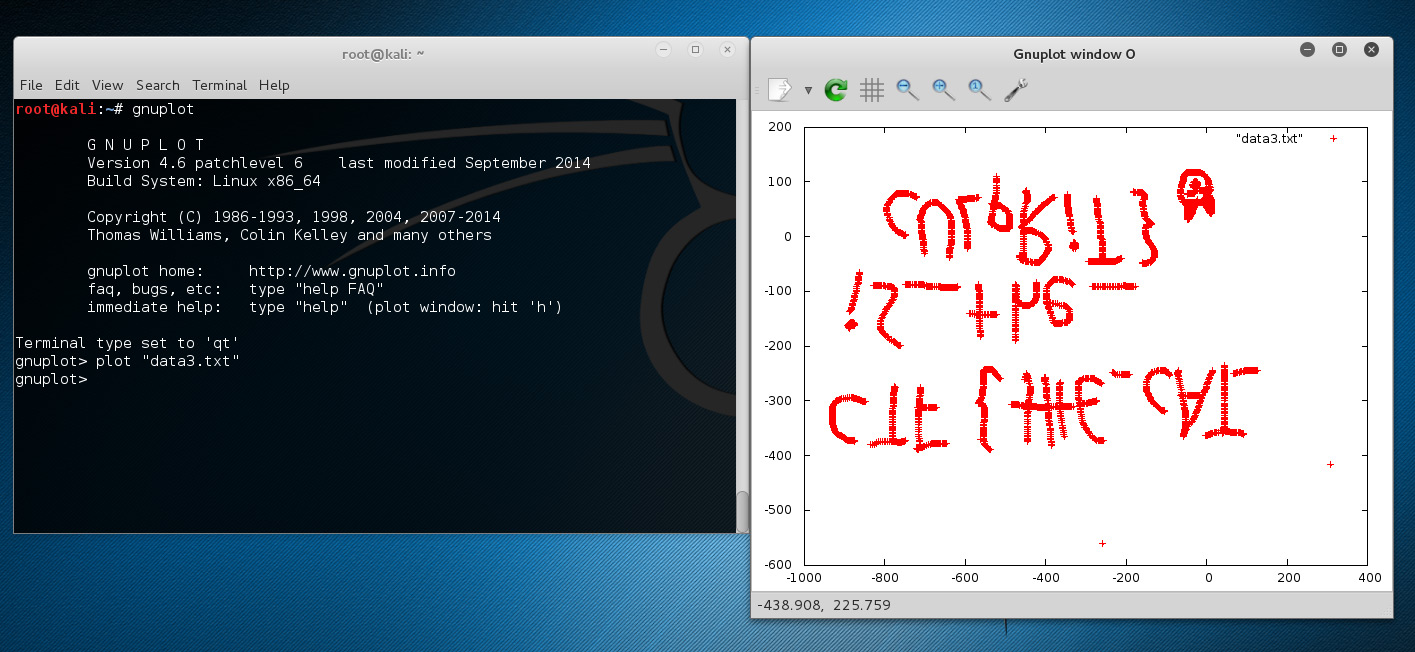
As shown once run, the Gnuplot window opens with our flag, albeit upside down.
At this point I simply put the image into Photoshop and flipped it vertically to make it more readable, the final result is shown below.
The flag is shown as CTF{tHE_cAT_iS_the_cULpRiT} with what appears to be the face of the cat.
I did originally attempt to use this USB Reverse Engineering tool which in theory would take a pcap file and draw the movement out automatically, however when I ran this with my pcap I simply got a blank graph output.


You should really give credit to where you got that awk function from: https://github.com/ctfs/write-ups-2015/tree/master/boston-key-party-2015/school-bus/riverside
Thanks, I thought I had all my external references in place but it looks like I missed that one! I’ve updated the post now.
Thanks for updating. I only recognized the function because I used it too when I solved this :)
I am getting output as simple points plotted in the graph. How did you join them as to form some text?
That’s just how it appeared in Gnuplot for me, it’s actually a series of ‘+’ symbols close together for each point, so not sure if you can change how it displays.