The purpose of Cloud Linux is to improve the overall stability, reliability and performance of a shared server. Cloud Linux limits each individual account to a set amount of CPU and memory (RAM) resources. This means that rather than a server going under load and becoming slow for all users on it, only the account causing problems will be restricted. As Cloud Linux is becoming more common on shared hosting servers, it is important to know how to troubleshoot common problems that come up when using it to get the most out of your website and hosting environment.
I’ve used Cloud Linux for over a year now and think it’s great when used correctly, this article includes everything I have learned while using it during that time. A lot of users don’t like it because they have experienced it cutting the performance of their websites. With this guide you will be able to pin point issues and then work on resolving them. Although this information is aimed towards the server administrator, users within the Cloud Linux environment will find useful information for checking logs to find problems with their websites.
This article will be focused around cPanel, however most of the main points about Cloud Linux will still be directly useful for other control panels, such as Plesk.
The server I am running Cloud Linux on in my examples was running CentOS 5.8. It has 4 CPU cores and 4gb of RAM, this is taken into account later when going through limits.
How Cloud Linux limitations actually work
Before being able to identify issues you need to know how Cloud Linux actually works. Limitations can primarily be broken down into memory limitations and CPU limitations.
The memory limitations:
Cloud Linux places limits on virtual memory, not physical memory. While a server may have 4gb of physical RAM on it, the amount of virtual memory the server can provide is much higher. This means that a PHP script that reports using 200mb of memory may only be using 20mb of physical memory for example.
Have a look at the below image taken from a test server, namely the VIRT and RES columns, then see the information from the ‘top’ manual page below.
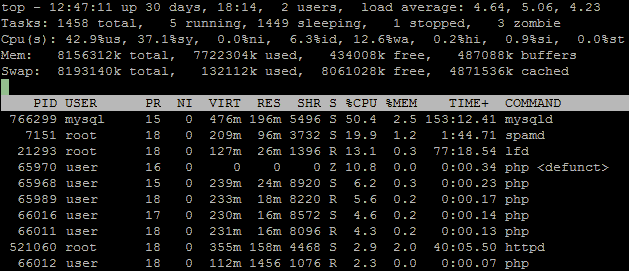
Alright so now we get a bit technical, the important thing to note is that basically VIRT is virtual memory (what Cloud Linux limits by) and RES is physical memory, which is what actually uses the RAM on the server – and no available RAM can turn into load problems as things start to swap to disk. As long as you have that concept under control, feel free to skip the snippet below.
VIRT: The total amount of virtual memory used by the task.
It includes all code, data and shared libraries plus pages that have been swapped out.
VIRT = SWAP + RES.

RES: Resident size (kb) The non-swapped physical memory a task has used.
RES = CODE + DATA.

SWAP: Swapped size (kb) The swapped out portion of a tasks total virtual memory image.
CODE: Code size (kb) The amount of physical memory devoted to executable code.
DATA: Data+Stack size (kb) The amount of physical memory devoted to other than executable code.
In the above top image we can see that the ‘user’ user is running a few PHP scripts using about 230mb of virtual memory per script, the physical amount of RAM used on the server is about 20mb per script or so – much lower. As long as the total virtual memory they are using running under that user is below it’s defined limit, there will be no problems.
The CPU limitations:
Cloud Linux places limits on total CPU being used as a percentage and it is done in a rather confusing way.
This limit sets the % of CPU being used relating to total number of CPU cores available on the server. This means that setting a 5% limit on an 8 core server will mean that each cPanel account can use up to 40% CPU of a single core. on a 4 core server a 5% CPU limit would mean 20% of a single core.
Here are a few examples of this:
15% limit on a 4 CPU core server = 60% of a single core
10% limit on a 4 CPU core server = 40% of a single core

15% limit on a 2 CPU core server = 30% of a single core
10% limit on a 2 CPU core server = 20% of a single core
This also means that setting an account to 25% CPU on a 4 CPU core server means that it can use an entire CPU core to itself – possibly too much for a shared hosting account, you may need to look into a VPS if you require this or more. If you set a limit 25% or higher in this instance, it wont make any difference as an entire core is already being allowed for the limit.
This is calculated as follows:
(1 core x 100)/total cores = maximum percentage.
There are further examples posted in the Cloud Linux documentation here.
You can set the amount of CPU cores used for an account, the server default is 1. Allowing an account to use more than 1 CPU core causes an overhead with Cloud Linux meaning it will use more resources so keep that in mind. If you change the amount of CPU cores per account you will need to restart the server.
In my experience users have more noticeable problems with memory limits rather than CPU limits. You will need to tune these depending on the hardware specifications of the server and resource usage of your users. You can provide decent performance for most normal users while still preventing servers going under load and causing problems for everyone on the entire server. With Cloud Linux only the user creating the problem is affected.
IO limits
At the time of writing, Cloud Linux does not implement IO limits in my version which is 5 (unless in beta). Recently IO limits for Cloud Linux 6 were released to production so it will be interesting to see how this contributes to server usage in the future. It will definitely be good in allowing shared servers that still use traditional hard disks to have less access time for content, as high resource users will be denied complete server resource domination.
Managing Cloud Linux settings
You can manage Cloud Linux using the LVE (Lightweight Virtual Environment) Manager through WHM, just search for “CloudLinux LVE Manager”. This provides a GUI interface, you can of course manage things through the command line if you prefer. When you first enter the LVE Manager you’ll be on the home tab, you will see a list of current users using resources on the server at the time the page is loaded. Note that a new version of the LVE manager was released less than a week ago with a new interface, it still has the same basic functionality however but has the ability for you to apply limitations on different packages.

There are 4 other tabs here used to manage Cloud Linux:
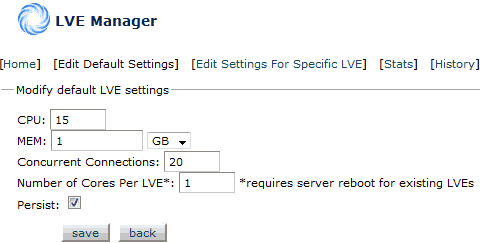
Edit Default Settings: This is used to edit the settings for the WHOLE server. You can see what the current server limits are by checking here.
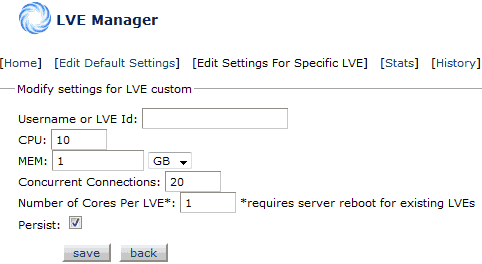
Edit Settings For Specific LVE: This is used to edit the limits on a specific account. You just need to find a cPanel accounts username, place it into the username field and then set the limits and save. Limits should typically only be increased after investigation of any current issues with the account, it’s best to solve the root cause than just delegate more resources.
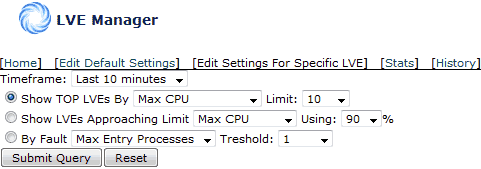
Stats: Clicking stats will make a new interface appear and will let you find useful statistics about usage for an LVE.
History: The History function is extremely useful, you can look at past usage of an account to identify when issues occurred as you can see how many resources have been used. This then gives you times to check logs for problems.

Understanding Usage
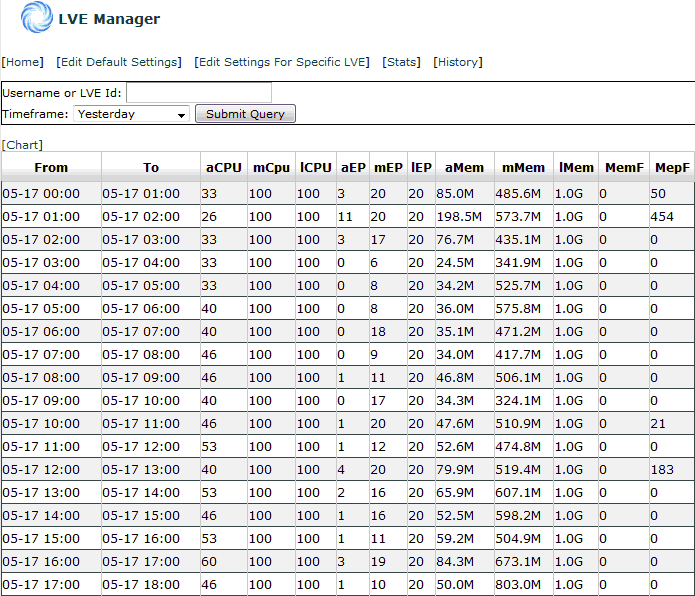
Before you can identify problems you need to know what all the variables mean in the statistics that you’ll be investigating. A good way to start investigating a potential Cloud Linux issue is to check the history and see what a user has been using as shown above with the history tab – this will bring up something like the image below. This was pulled from WHM, however a user can view similar graphs and data on their account through cPanel.
Now that we have all this information on a user account, what does it all mean?
| From/To | The time period the information is from |
| aCPU | Average CPU usage (as a percentage out of 100%) |
| mCPU | Max CPU usage (as a percentage out of 100%) |
| lCPU | CPU Limit (always 100% – 100% of what ever limit in place) |
| aEP | Average Entry Processes |
| mEP | Max Entry Processes |
| lEP | maxEntryProc limit (concurrent processes, limited to 20 (default)) |
| aMem | Average memory that has been used |
| mMem | Maximum memory that has been used |
| lMem | Memory limit assigned to the account |
| MemF | Out Of Memory Faults |
| MepF | Max Entry processes faults |
Now we can evaluate the performance of the example account in the above image, we’ll look at CPU, Memory and then processes. We explore finding the causes of all these issues further below under the “Identifying common problems” section.
CPU: On average (aCPU) we can see that CPU usage for this account is around 40% or so (4 core server with 15% CPU limit, meaning the account can use at most 60% of 1/4 of the CPU cores, of which 40% out of the whole 100% is in use on average). Every hour you can see that the maximum CPU (mCpu) is 100 – this just means that the highest amount of CPU the account has used within that period has hit the limit (lCPU) of 100% (all available CPU to the account, meaning at times the account has been using 60% of a whole core – quite busy!). As the limit is being hit at times the website on the account may load slowly during these periods, however as the average isn’t too bad in general it should be alright, the CPU usage may just be bursting.
Memory: Here we can see the account is limited to 1gb of virtual memory (lMem) – the recommended default by Cloud Linux. On average (aMem) the memory usage is actually quite low aside from a spike at 1am, average under 100mb is great. The maximum memory (mMem) being used never matches the memory limit in our example. This means the memory limit has not been hit during any of the time periods in the above example image – no internal server errors specifically caused by Cloud Linux memory limits would have been displayed.
Below is a quick example of a random account with a memory limit of 512mb which is hitting its memory limit frequently. You can see that maximum memory is actually surpassing the limit because it was being hit so hard in quick succession (caused by load testing).
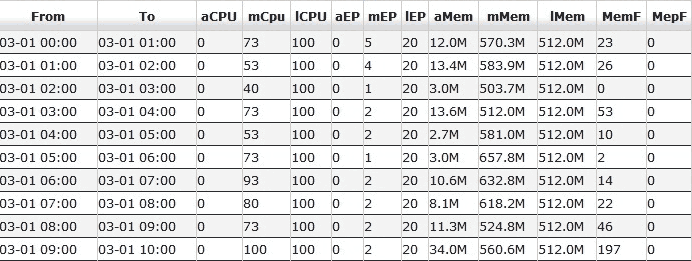
You can see MemF (memory faults) displays the total amount of times where the memory limit has been hit. In the above example this is almost always and this is because of a PHP script that is being executed. When this happens it will report it in the error log so the cause of the classic Internal server error page can be tracked to a script. In any case the MemF variable shows us how many times the memory limit has been hit during that time period which is useful historical information for investigative purposes.
Processes: if you look at the first example image higher up (the larger of the two), you can sees that average processes (aEP) are actually quite high, the limit of which is set at 20 and is default for each account. The limit is being hit at times (lEP) as the maximum being run during a period (mEP) is being hit at 20, the best example being at 1am.
Maximum process entry faults (MepF) shows us how many times that maximum process limit has been hit which has happened here quite a bit. When this happens the connection attempting to be made will result in a 503 error to the browser. This limit is in place to prevent an account using all Apache connections (controlled by the MaxClients variable) and bringing down the whole web server despite there being plenty of CPU/Memory available.
Useful Cloud Linux tools
There are some useful commands which Cloud Linux comes with that you can run through command line:
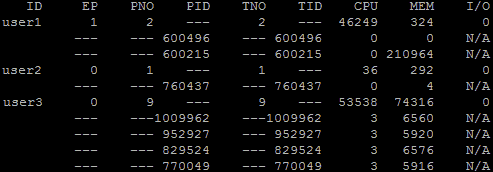
LVETOP: The ‘lvetop’ command will show you CPU, Memory and other usage for a particular account in real time, as shown in the image below.

Lvetop fields:
| ID | Username if LVE id matches user id in /etc/passwd, or LVE id |
| EP | Number of entry processes (concurrent scripts executed) |
| PNO | Number of processes within LVE (within the account) |
| TNO | number of threads within LVE (within the account) |
| CPU | CPU usage by LVE, relative to total CPU resources of the server |
| MEM | Memory usage by LVE, in bytes |
| I/O | I/O usage (currently not implemented at time of writing) |
LVEPS: The ‘lveps’ command shows more information about running LVEs, run with below flags.
| -p | Print per-process/per-thread statistics |
| -n | Print LVE ID istead of username |
| -o | Use formatted output (fmt=id,ep,pid,tid,cpu,mem,io) |
| -d | Show dynamic cpu usage instead of total cpu usage |
| -c | Calculate average cpu usage for |
| -r | Run under realtime priority for more accuracy (needs privileges) |
| -s | Sort LVEs in output (cpu, process, thread) |
| -t | Run in the top-mode |
For example running lveps -p will show you all the processes being run under an account. You can then investigate these specific PID’s if they are hanging around for too long and see what they are doing using something like strace.
LVEINFO: the lveinfo command is extremely powerful for seeing server wide statistics, more information is found here. Run lveinfo -h to get an output of all the various flags.
For example the command below will output the top 50 users from the date specified until now by total memory faults, this tool lets you easily see which accounts are hitting the memory limit during a specified time period. As you can see this lets you look up very specific information on different user accounts on the server.
lveinfo -f 2012-05-21 --order-by=total_mem_faults -d -l 50
As you can see a lot of useful information from Cloud Linux can be extracted in real time with these tools, be sure to monitor them while loading various pages and refreshing them to get an idea of the resources being used.
Identifying common problems
We will now look into the two most common Cloud Linux problems, when an account uses all it’s resources and hits either the CPU or memory limit. The causes can be hard to identify, the problem could be to do with the amount of resources a website requires, the amount of traffic it is getting which may be a legitimate spike or a malicious one thereby causing more resources to be used, or 10 other different scenarios.
Memory Limit Problems:
Returning to my previous example image of the memory limit being hit frequently, we will work through the causes of this.

You can see MemF (memory faults) displays the total amount of times where the memory limit has been hit. Every one of these instances generally translates to a 500 Internal Server Error in a users browser and this is typically from the limit being hit due to a PHP script. When this happens it will report it in the error log (/usr/local/apache/logs/error_log). You can search this log for a user and find the script which caused the memory fault. Through cPanel you can also view your error logs if you have access and do the same.
Here is a useful command for scanning the error log in reverse (to get the newest entries first) for a cPanel account username. You can replace tac with cat to view it in the normal order from oldest first. We grep the log for the username, then the string “memory” as you will see soon that this is part of what will appear in the log.
tac /usr/local/apache/logs/error_log | grep username | grep memory
An example from the error log using the above command:
[Sat May 05 20:58:07 2012] [error] [client 123.123.123.123] (12)Cannot allocate memory: couldn't create child process: /opt/suphp/sbin/suphp for /home/user1/public_html/blog/index.php, referer: http://www.website.com/blog/
We can see that the external IP that hit the site to cause the error, the tell tale “Cannot allocate memory: couldn’t create child process” showing us memory couldn’t be allocated, as well as the file that caused the memory fault because it was not able to get a hold of the required amount of memory to complete execution. This is when the 500 Internal server error message shows up because the script is killed off and can’t finish. We can also see the referrer, which is the page that attempted to execute the script. Note that this error may happen for plenty other of non Cloud Linux related reasons, it is however a sign of the memory limit being hit if it is happening on and off.
In this instance we can see the cause is index.php – most of the time this is the script that hits the limit but it may not be the root cause. The problem with various content management systems is that they call out to other scripts and funnel everything through the index script meaning that tracking down the exact issue can be quite difficult.
In the instance of index.php being the problem, some useful tips include disabling additional plugins or features to see if that helps with memory use, or to upgrade the software / plugins in use as well as any other scripts to the latest version as old code tends to not be as efficient as newer more refined code.
CPU Limit Problems:
Problems due to the CPU limit are less common in my experience, but are investigated the same way. Basically you can check the history through LVE manager and see if an accounts average CPU is high, if average use is above 75% or so and the maximum is being hit at 100% it may indicate an issue. Issues directly related to CPU power will show as a website loading slow (of course this can be caused by many other issues such as the size of contents and the location they are downloading from, so make sure you investigate).
You can load a page and refresh it every few seconds to simulate page views while running the lvetop command through SSH to get an idea of the accounts usage. You can also have lveps and/or top running to get an idea of the processes and files executing. If you run top, press the ‘c’ key and you will see the full path to the PHP script being executed. If you notice the account has a particular script running frequently and using resources, or you notice it in the error logs then you have something to look further into.
The other issue that comes along with CPU limits is the classic 503 error “503 resource unavailable” can show up as an error if too much CPU is attempted to be allocated to an account. It more frequently happens when the concurrent process limit (20 by default) is hit. This means 20 processes are running as the user and Cloud Linux is preventing new ones spawning.
You can of course just increase the limits on an account to allow them to consume more, however this is not optimal, it’s best to find the cause, if it’s legitimate and if it’s even required. For example additional malicious traffic may be causing PHP scripts to run using resources, or some custom scripts may have been coded poorly. I’ve had a case where malicious PHP scripts were added to a users hacked account and these were using all the resources causing the site to perform badly, you wouldn’t want to increase resources and help something like this run better. In either instance increasing your limits will most likely cause you more problems in the future, it’s better to try and address the root cause.
Problem identification
ALL processes running as the user contribute to the total resource usage, not just PHP scripts. This is an important point to take away, not only should you look for PHP scripts which will tend to be the primary cause of issues, but you should also look at the total amount of processes being run as a user. You can check the current processes that a user has running through SSH with the following command.
ps aux | grep username
This will output something similar to the following.
user1  858431  0.0  0.0  10684  1068 ? S 14:25  0:00 /usr/lib/courier-imap/bin/imapd /home/user1/mail/domain.com/account
user1  858672  0.0  0.0  10588   864 ? S 14:25  0:00 /usr/lib/courier-imap/bin/imapd /home/user1/mail/domain.com/account
user1  858677  0.0  0.0  10592   908 ? S 14:25  0:00 /usr/lib/courier-imap/bin/imapd /home/user1/mail/domain.com/account
user1  858696  0.0  0.0  10592   956 ? S 14:25  0:00 /usr/lib/courier-imap/bin/imapd /home/user1/mail/domain.com/account
You may have been expecting to see PHP scripts, and yes you will see these if there are any executing at the exact moment you run the ‘ps’ command, and this is great to see if anything is hanging around using resources. In the past I’ve seen poorly coded scripts hanging around staying open and holding onto resources when they shouldn’t be, causing the account to be hit by Cloud Linux limits.
An important point to take away here is that imap/pop requests are served as the cPanel user and therefore are subject to LVE limits. You can see an example of this above, basically this email account being connected to is taking up a few of the maximum processes – it’s important to consider all processes a user is running as these eat into the CPU, memory and process limits.
But my site was working fine recently…
You will often see people saying this, first you would want to confirm if any changes have been made, “updates” or other website changes to code can definitely be the cause to a sudden problem so working out if anything has been modified recently is a good place to start in identifying the problem.
This will show you all files in the directory with the newest modified first down the bottom, you may want to run it within /home/user/public_html for example.
ls -lrt
This will show you files sorted by date recursively in a directory, so you can find all new files within /home/user/public_html easily.
find . -printf '%T@ %c %p\n' | sort -k 1n,1 -k 7 | cut -d' ' -f2-
You really want to pay attention to any PHP files that may have been modified recently, from there you can see if the file has been accessed recently which may help identify that it’s being accessed when browsing a sites content (as well as checking the error logs to see the problematic script).
stat index.php
The ‘stat’ command will give you the access, modify and change times of the file.
Access: 2012-05-21 01:45:35.000000000 +1000
Modify: 2006-11-21 17:25:49.000000000 +1100
Change: 2011-10-26 04:49:48.000000000 +1100
Checking access logs
Limits could be getting hit due to either legitimate or malicious traffic increase (more traffic translates to more resource usage and this could be temporary), we can determine this and possibly prevent the access attempts by checking the access logs if they are not legitimate.
First enter the directory where the user logs are stored, replacing username with the cPanel account name.
/usr/local/apache/domlogs/username
Once in here you will see a file in the format of “domain.com” which is the access log for the domain, we can then run the following command on the log file to pull out all the IP addresses that have accessed the site and sort them by the total amount of requests first, making it easy to find potential problems.
cat domain.com | awk '{print $1}' | sort | uniq -c | sort -nNote that the log probably may only go back 24 hours or so, you can check by reading the head command on the file. Depending on the configuration settings there may be logs going further back for you to compare with and get an idea of normal usage.
This will output something like the following (these are the last 4 entries in the logs from a long list – the highest users):
1240 111.111.111.111
1271 112.112.112.112
1312 123.123.123.123
7981 100.100.100.100
9122 101.101.101.101
The first number is the total amount of accesses requests to the web server, containing GET and POST requests while the second number is the IP address. Doing a lookup on an IP address we can see that there is an IP that has had over 9000 requests to the web server for this particular account. The IP addresses are of course examples in this instance, but if you saw an IP performing a large amount of requests and it was from some other country and does not look legit, you may have an issue. Grep the access log specifically for the IP address to see the sort of things it’s doing, it may appear to be normal accesses or for example the IP could be sending POST requests to a PHP file in attempt to perform SQL injection and hack the website.
If you see something with a large amount of requests that you believe to not be legitimate you should either add it to the firewall deny list that is being run on the server or create a .htaccess deny rule in the users public_html to deny access from that IP. The second method will cause Apache to still use resources for the request so blocking at the firewall level when possible is better for something obviously less than legitimate.
Something common that you may see is that a site will be getting indexed from a search engine such as Google, so the IP’s hitting it frequently will be Google, Yahoo, Bing etc. Generally there isn’t much we can do about this as the site is most likely being re-indexed, so you shouldn’t block the accesses, you would just inform the user that currently the site is getting hit a lot by various search engines which is using more resources than would otherwise be used during normal website operation. I’ve seen this where Google and Yahoo were causing large amounts of custom coded PHP scripts to run at once and it was causing problems for other people browsing the website.
Troubleshooting the code
This is something left to the user of the account, however there are some variables that can be added throughout the code that will print memory usage to the browser when the page is loaded, these are not very accurate as it will depend where about they are being run.
memory_get_usage – Returns the memory usage allocated by PHP for a script at the time it’s invoked.
memory_get_peak_usage – Returns the peak memory allocated by PHP for a script.
If the user is running customized code rather than a standard content management system and they are not able to perform optimization themselves they will most likely need to contact a web developer if the code is obviously having issues.
Lowering memory_limit in php.ini
Lowering the memory_limit variable in a users php.ini file doesn’t really help with Cloud Linux memory limit problems as there will just be a lower total amount of memory defined for the script. Instead if all memory is used the script will return a fatal error with how many bytes it tried to use in comparison to the 500 error.
Other tips
Check for multiple domains under a cPanel account
Cloud Linux places limitations on a per cPanel account basis meaning if an account has add on domains under it (or even lots of subdomains) that are active, all of the domains will be subject to the same limits. You can identify the sites being accessed most from the access logs, if multiple sites are constantly being hit then the user would be better off having the account as it’s own cPanel account so it has it’s own limits and is not affected by other websites running within the same space. This may be a limitation of the hosting package, however some hosts do allow for additional cPanel accounts and these should be utilized under Cloud Linux.
Run a load test
You can identify potential problems by running a load test using Apache Benchmark (AB), basically you can specify how many instances should run as well as the concurrency level to try and simulate real traffic.
For example if we have the following script in the problem account:
php echo "test";
Then we run the following from another external server:
ab -n 20 -c 5 -v5 http://domain.com/script.php
| -c (concurrency) | Number of multiple requests to perform at a time. |
| -n (requests) | Number of requests to perform for the session. |
| -v (verbosity level) | Prints out results, level 4 and above prints information on headers. |
You will get the output printed to your terminal, you may see that a simple script like this is still returning an internal server error. In this case you need to check “ps aux | grep user” as outlined previously to be sure they have no other processes open. If they don’t then it may be a server issue – see the “If everything else fails” section below.
Note that when running your load test you may hit your Cloud Linux limits, while this will give you an idea of what your website can take keep in mind that people attempting to view the website at the same time that the test is executing may be presented with error messages as the test is using the resources.
Use the watch command
You can use the watch command to make your commands automatically refresh, for example the below command will show you lveps every -n seconds. This will allow you to monitor usage of an account while browsing through it’s website to see how usage is going.
watch -n 3 lveps -p
Caching
You can avoid having to process resource intensive PHP scripts on the fly where possible by implementing caching. There are various plugins for content management systems that will basically store pages of the website as static html files. This means that when a user attempts to view a page, the web server serves them the html version of the page rather than processing the PHP scripts associated with generating the content.
This can save you a lot of resources and is definitely worth looking into as a good solution for solving resource usage limits under Cloud Linux.
If everything else fails
From time to time, LVE Manager will report a users history as using a lot of memory, and that they are hitting the limit at times. The error logs will even show the script causing the “problem” so it would appear like a normal issue of resource limits being hit. A few times I have seen that there was not actually a problem with what the user was running. Even when the user was running nothing attempting to run a simple PHP script that just echoed out a line of text was failing.
You can try restarting lvestats which is what collects LVE usage statistics and lets you query the data.
If something goes wrong this information can be incorrectly reported and accounts could be limited based on false information. I have not been able to produce these issues at will, however the fact that I’ve been able to resolve issues for multiple accounts on different servers by simply restarting lve suggests otherwise.
There are also instances where lveinfo, lvetop etc all report 0 memory being used for all accounts, if you get this it may be possible that either memory is no longer being limited, or it just isn’t being recorded. Either way all these rare issues are almost always resolved by stopping Apache, and restarting the lve and lvestats services, then starting Apache back up afterwards.
service httpd stop
service lve restart
service httpd start
Should I increase a users resource limits?
You would want to do this as long as it’s justified, a user may be performing a legitimate task and all other troubleshooting has failed. If you have the available resources then this can help the problem however it is more of a band-aid fix rather than fixing the root cause of the problem.
Contacting Support
In my experience Cloud Linux support are very responsive and helpful, if you still have an unresolved issue then you can send it on to them, details are on the support page here.
Summary
Congratulations, you are now a Cloud Linux master! There has been quite a lot of content here but I hope that it is all of use, I’ve tried to provide examples of problems based on my experience and methods of tracking down problems in order to get the best out of Cloud Linux.
I came here after seeing the post on the LinkedIN Cloud Linux Users Group. A very informative and detailed post.
It would be good if you could do a followup post with the introduction of IO related limiting present in the Cloud Linux update.
It’s the plan, once IO limits are in production for Cloud Linux 5 I’ll be keen to test those out and see how they go.
In a situation where you have WHM/cPanel+CloudLinux6.3 installed but with only one account; what is the best way to just remove all limits and let the only account have all resources available?
What are you using it for if you just have one cPanel account?
Basically all you need to do is just set the default limits to all 0 (no limit) and your one account will not have any limits subject to it.
Note that if you introduce future accounts they will also not be limited this way (unlimited), so alternatively you can leave the global default limits in place and just set a custom limit on your current account.
All this can be done through the Cloud Linux area in WHM, alternatively you should be able to do this through command line if you have the lve-utils package:
lvect set default –cpu=0 –pmem=0m
Thanks Jarrod,
I hadn’t seen the defaulting to 0 (zero) option for unsetting limits, before.
FYI, it is a single account only because it was an automated migration of a very heavy user from a shared environment to a dedicated machine. Overkill? Yes. Efficient migration? Absolutely.
Cheers
Was wondering to know if cloudlinux works good with WordPress? Going with CL costs additional amount but keeping the CPU eating nature in mind, would it be feasible to use CL on servers?
A lot of the accounts I’ve managed under Cloud Linux ran WordPress and there were no major issues. Some times you may see accounts using all allocated resources because of dodgy plugins or themes, but that can be mitigated a fair amount by making use of caching plugins such as WP Super Cache which will reduce a lot of the load on the server by PHP and MySQL for example.
Hi Jarrod,
I’ve enjoyed your post very much. The biggest confusion I see with CloudLinux is with the memory limits. I would like to use CloudLinux but I’m afraid I won’t configure it correctly, which is an easy mistake to make.
I do understand the difference between virtual and physical memory, but I yet cannot comprehend the difference between account memory and php memory limits as far as smooth web hosting is considered.
If I limit the memory to 128MB per account, what should I set the PHP memory limit to? This is something I can’t get my head around. People say all kinds of things, what do you think is considered good practice?
Kind regards,
Mark
This is just what we needed. We have just gotten a KVM Vps and we are currently configuring cloudlinux…
:razz:
Excellent article – a better explanation than Igor himself offers on the CL docs pages (which are considerably out of date!)
One question, If I have 2CPUS and 2.GB RAM what would be a good recommended default setting? Currently CPU is set to 10% and memory should at 1GB, & Number of cores set to 1. Individual LVEs are typically set at 25% CPU and 1GB Ram, 20 concurrent connections and 1 core. Would you say this is a reasonable starting point for a VPS?
Thanks
Thanks! Glad I was able to explain it well, I think some of the documentation around CPU usage has been fixed up a bit, back when I wrote this thought it was very confusing and I had to contact support a few times to correctly understand how the limits work.
Personally I tend to limit each account between 40-60% of a single CPU core, so for 2 CPUs I’d probably set the Cloud Linux limit to 20% (40% of one core) to begin with then increase it further if required. That said if your 10% limit is fine for the users and you don’t have resources to spare then stick to it and just increase slowly as required.
As for the RAM the recommendation from Cloud Linux seems to always be to set it to use 1gb and increase from there if you have issues. I attempted 256mb/512mb in the past but they were no good too many users had problems, 1gb seems to be the sweet spot.
Thanks Jarrod, your article has certainly helped me to get my head around this. My VPS was crashing a lot over the space of a few days and my tech support recommended CloudLinnux. When I read about it, I realised this was really an essential tool for a shared client environment (actually I was over-joyed to ‘find’ such a tool!).
It’s a bit disappointing that the official docs are so poor – maybe it’s just me, but they seem very sparse and inadequate for a newbie, so your article helped me a lot (even just to understand the abbreviations!) – Igor should hire you to write their help docs :-)
Overall, I’m happy with the way CL is running and the stats seem to be fairly intuitive once you have a couple days of history to look through for each account.
One thing I think is missing is some kind of alert system that will notify admin of persistent 501 / 503 errors for a given account (e.g. if a site hits 100% cpu 5times in 1 hour). This would provide admins the chance to proactively look into a site’s performance (hopefully) before the clients writes in to complain! The discussion for this feature request is here and if you feel it would be beneficial, perhaps you could add your voice to it.
http://www.cloudlinux.com/solutions/forum/forum11/topic291/
Another concern not really discussed anywhere is how CL may affect a users email. Whilst it’s clear that dovecot or any other mailman system associated to a user will be governed by that user’s resource limits, what’s not clear is how this would affect delivery of mail – e.g. where does it go, does it sit in the mailqueue awaiting resouces to enable sending/delivery or will it just bounce? To some extent, this topic is discussed here on the cPanel forum interesting and useful (although typical confusing / contrary opinion, Igor does chime in to clarify certain aspects) http://forums.cpanel.net/f391/application-resource-limits-cloudlinux-252302.html
Keep up the good work :-)
Sol
Thanks! The request about being notified about the errors would be useful, though some accounts get so many perhaps being able to rate limit it would also be a good idea.
As for the mail, I’m not actually sure what happens when there are no available resources, I just noted that the processes counted towards the users maximum resource usage which could cause other issues, so that’s interesting if it will cause mail to fail.