I’ve been benchmarking different web servers recently and this post contains all of my results as well as information on how the tests were performed during the process.
I have benchmarked Apache 2.2, Apache 2.4, Nginx, Lighttpd, Varnish, Litespeed, Cherokee and G-WAN web servers when running on 1 CPU core, 2 CPU cores, 4 CPU cores and 8 CPU cores while loading a 100 byte static HTML page to determine the difference between them in performance.
2016 Update: I have run the tests again with up to date web server versions in 2016.
This was my first real attempt at a proper web server benchmark – I’ve had the data for a little while now so if there are any problems or issues with the tests that I have overseen please let me know.
Before the results I have a fair amount of detail explaining how the tests were performed, if you just want to get right down to the results scroll down.
The test environment
For this test I had 8 virtual machines on top of VMware ESXi 4.1, so note that performance of the hardware may be skewed based on the hypervisor itself and the way it both manages and uses the available resources. With that in mind, all virtual machines were run under equal circumstances so while I am not benchmarking the virtualization the results from the web servers are still directly comparable against each other throughout my tests.
Every virtual machine had a clean install of Debian 6 64 bit and one virtual machine was used per web server, so for example one virtual machine was used for Apache 2.2 while a separate one was used for Apache 2.4 to ensure there was no interference.
The web server versions tested are as follows, and were all the most up to date versions at the time of performing my tests.
- Apache 2.2.22
- Apache 2.4.2
- Nginx 1.2.2
- Litespeed 4.1.13 Standard
- Varnish 3.0.2
- Lighttpd 1.4.28
- Cherokee 1.0.8
- G-WAN 3.3.28
The underlying hardware that VMware was running on top of was as follows:
2 Intel(R) Xeon(R) CPU E5649 @ 2.53GHz
150GB Memory (RAM)
The assignment of resources to each virtual machine varied as I tested 1 CPU core, 2 CPU cores, 4 CPU cores and 8 CPU cores. During every test however each virtual machine had 4GB of RAM and 20GB of hard disk space. It is important to note that during every test each virtual machine had full access to the resources as no other ones were running simultaneously.
Tools
The tools used for this test primarily consist of Weighttpd which is my benchmark tool of choice, and then Microsoft Excel for the simplistic graphs that display the results.
The classic Apache Benchmark (AB) tool was not used due to its lack of threading and being able to take advantage of how modern web servers run. I did experiment with this tool but found that it was giving very poor results in comparison to weighttpd.
Constraints
These are the constraints around the tests that I ran, this will give you an idea of how the tests were performed and the reasoning behind that.
The weighttpd benchmark tool was run on the same server that the web server was running on. This will obviously mean that some of the resources of the server will be used for the benchmarking tool itself rather than all solely on the web server so it is important to keep this in mind. Many will say that not testing the network doesn’t constitute a “proper” benchmark, and to that I say that I am primarily benchmarking the web server software under equal reproducible instances. Of course there is overhead in the TCP/IP stack, I may test this in the future.
Weighttpd was run using this script from G-WAN developer, Pierre. The script he has provided allows you to run benchmarks at intervals in an automated manner, saving time and effort. Rather than running multiple tests manually at different concurrency levels the code above will do the lot for you.
Here is an example of what the script actually ran when compiled and executed.
weighttp -n 100000 -c [0-1000 step:10] -t X -k "http://127.0.0.1:80/100.html"
Basically -n is the number of requests to perform, -c is the concurrency level and this is stepped through from 0 to 1000 in increments of 10. First 100,000 hits to the web server are completed at 1 concurrent request at a time, and then 10, 20, 30 … until 1000, increasing in steps of 10. On top of this the script runs 10 iterations of each command in order to get an average result, meaning in total there are 1,000,000 total requests to the web server.
-t is automatically detected, it is the number of threads to run and is dependent on the amount of CPU cores detected on the server. -k is for keepalive, and this was run on all tests as it is generally enabled on production servers – keepalive was also enabled in all web servers. The test is looking for 100.html which is hosted on localhost in every test.
Another thing the script does, is for each concurrency step it records the minimum, the average and the maximum requests per second. This means that at each point of concurrency, we have an average of 1,000,000 requests being completed in which to justify the result. I found better results by having this as a large number, the tests did take a long time to complete however it is more accurate as it allows the web servers time to peak.
As mentioned previously this test is comparing various web servers against each other under the same circumstances, which is loading a static 100 byte HTML page. You may not consider this a “real world” benchmark, however when benchmarking it is still worth gaining an idea of the “raw” performance of what the web server can do. Some times you want to know how fast your engine is, rather than how fast the car can go. That said it is still important to remember that you can’t ride alone on the engine, and that the car is limited to the engine speed.
During each test only one virtual machine was powered on a time meaning that it had full use of the resources. While a single virtual machine was running and being benchmarked there were still available resources at the hardware level while the virtual machine was maxing out CPU in all instances. This confirms hardware is not bottlenecking anything in my tests.
Prior to every benchmark run the web servers were completely rebooted to ensure that none had any caching advantages.
To avoid “pointless” disk IO during the benchmark process, all error/access logging was disabled as such large numbers of requests were coming through that this was slowing down some runs.
Please note that the purpose of these benchmarks was to compare the web servers on the same hardware in a real world environment, not to try get best performance for each web server. While some configuration was changed to get better results there are of course other optimizations and settings that could be changed to slightly affect the results one way or another on all web servers.
The Litespeed web server was only benchmarked at 1 CPU and 2 CPU cores as this is all the standard licensing allows for. I thought it was still worth including the results in half my results to see how it compares.
Server configuration
I have made configuration changes to /etc/sysctl.conf on all virtual machines as various limits such as the amount of open ports was being in use was running out causing connection failures (ephemeral ports).
Here are my additions to /etc/sysctl.conf, you will see similar settings used throughout other various benchmarks to cut down on the TCP/IP stack being the bottleneck.
fs.file-max = 5000000
net.core.netdev_max_backlog = 400000
net.core.optmem_max = 10000000
net.core.rmem_default = 10000000
net.core.rmem_max = 10000000
net.core.somaxconn = 100000
net.core.wmem_default = 10000000
net.core.wmem_max = 10000000
net.ipv4.conf.all.rp_filter = 1
net.ipv4.conf.default.rp_filter = 1
net.ipv4.ip_local_port_range = 1024 65535
net.ipv4.tcp_congestion_control = bic
net.ipv4.tcp_ecn = 0
net.ipv4.tcp_max_syn_backlog = 12000
net.ipv4.tcp_max_tw_buckets = 2000000
net.ipv4.tcp_mem = 30000000 30000000 30000000
net.ipv4.tcp_rmem = 30000000 30000000 30000000
net.ipv4.tcp_sack = 1
net.ipv4.tcp_syncookies = 0
net.ipv4.tcp_timestamps = 1
net.ipv4.tcp_wmem = 30000000 30000000 30000000
net.ipv4.tcp_tw_recycle = 1
net.ipv4.tcp_tw_reuse = 1
The maximum amount of open files was checked with unlimit -a, and /etc/security/limits.conf had the following defined.
* soft nofile 5000000
* hard nofile 5000000
Of course these values aren’t what you would use in a production environment, they are for the purposes of the benchmarking process.
Web server configuration changes
This section details some of the configuration applied to the individual web servers. I didn’t make too many modifications as I am not trying to get perfect results on every web server, perhaps in an ideal world where I have more time I would do that. Also note that all tests performed went for quite a long time, and allowed the web servers such as Apache to start performing at their peaks.
Apache 2.2
Using the Worker Multi-Processing Module (MPM) the ServerLimit and MaxClients variables were set to 1000 were increased to allow for high concurrent connections.
Apache 2.4
The Event Multi-Processing Module (MPM) was used with Apache 2.4, as this allows more simultaneous requests to be served by passing off some processing work to supporting threads, freeing main threads to work on new requests.
MaxRequestWorkers was changed to 350, because with the Event MPM AsyncRequestWorkerFactor is set to 2 by default, and maximum concurrent connections is equal to (AsyncRequestWorkerFactor + 1) * MaxRequestWorkers. As MaxRequestWorkers was set to 150, this would not be enough for my maximum of 1000 concurrent connections in my benchmark, so it was set to 350 meaning hopefully it can support 1050 concurrent connections.
Nginx
worker_processes was changed to match the amount of CPU cores for the test as I found this to give best results, so it ranged from 1, 2, 4 and 8.
Lighttpd
Experimented with server.max-worker and found that it performed well specifying this to match the CPU cores.
G-WAN
This was run with the -w flag to match the amount of CPU cores, so for example for the 8 CPU core test, ./gwan -w 8 was run.
Results
Now that all that’s out of the way, here are the results of my benchmarking process as graphs.
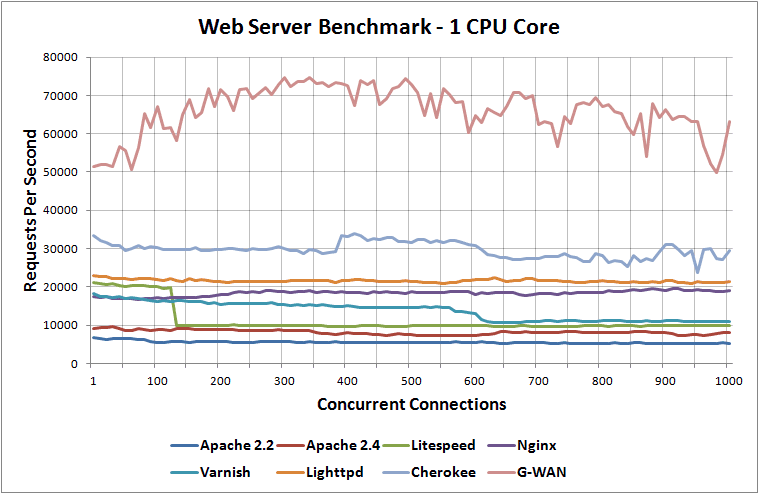
Web server benchmark results running on 1 CPU core.
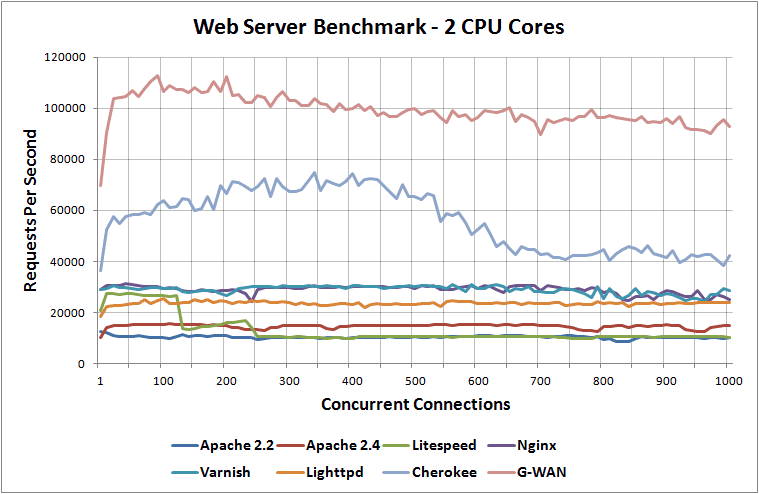
Web server benchmark results running on 2 CPU cores.
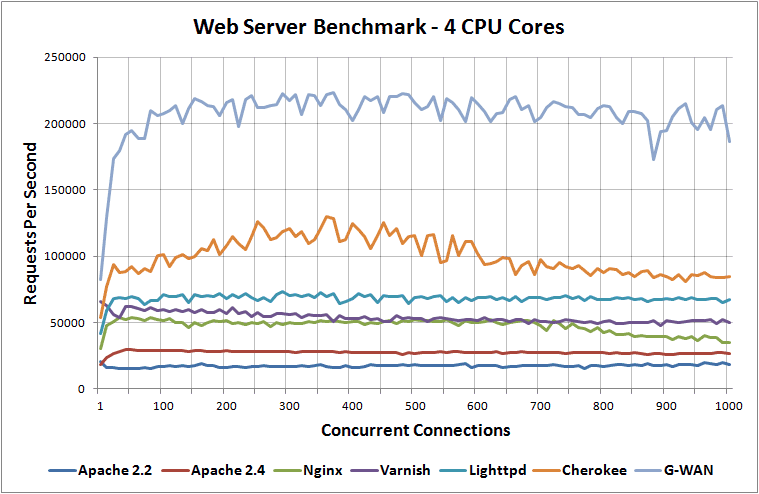
Web server benchmark results running on 4 CPU cores.
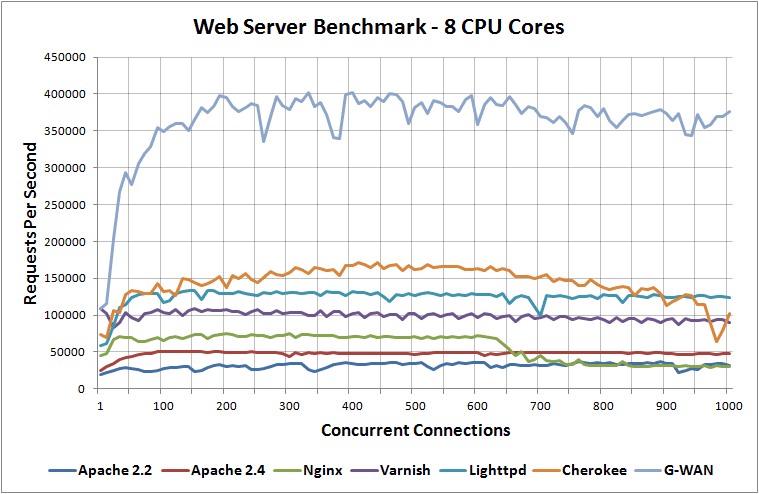
Web server benchmark results running on 8 CPU cores.
You can see in these tests that G-WAN is basically dominating the rest, it’s worth noting that this does not currently support PHP however I found it to be very interesting and less well known so thought I’d include it in my benchmarks.
Also in regards to Varnish as it is used as cache we would expect this to take the lead when benchmarking dynamic PHP content which I am keen to test in the future.
Elapsed time of benchmarks
I have the total times that each benchmark took to complete, you can find a text file of that data here. Below is a graph of it giving you an idea of how long each test took for each web server, on each number of CPU cores.
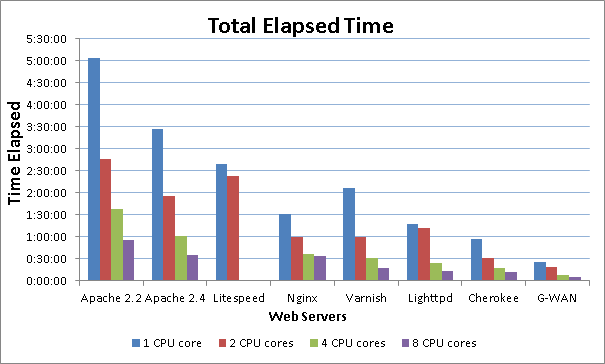
The times on the left are in the format of Hours:Minutes:Seconds.
Summary
There you have it, my tests purely of the web servers loading up a static page on localhost. I plan on performing similar tests on basic PHP pages or other web applications / content management systems to get a more overall realistic result as compared to a local static page benchmark. Until then I believe this data is still useful as it shows the power of each web server in these particular circumstances compared fairly against each other.
Before saying that these are not proper benchmarks, please consider the analogy I previously used. Some times you want to know how fast your engine is, rather than how fast the car can go. That said it is still important to remember that you can’t ride alone on the engine, and that the car is limited to the engine speed. This was a test of the engines available to us.
however when benchmarking it is still worth gaining an idea of the “raw” performance of what the web server can do. Some times you want to know how fast your engine is, rather than how fast the car can go. That said it is still important to remember that you can’t ride alone on the engine, and that the car is limited to the engine speed.
But you didn’t measure performance. In terms of your car analogy, you just measured maximum RPM without torque. Some small engines for toys have a big RPM ratio, ;) but it doesn’t mean that you should install one of them into your heavy truck.
Please, read this article: The many pitfalls of benchmarking.
Thanks, and good point. :)
I’d like to play with some more benchmarking tools that will give me more performance metrics rather than just maximum requests per second as I agree there are other important factors to gauge.
You can also play with various nginx directives, those changes its perfomance pattern, like: accept_mutex and multi_accept.
Also, please, look at open_file_cache, some of tested web-servers use it by default, but not nginx.
And check your nginx build, count of compiled in modules may affect perfomance. It would be a good idea to build it without any 3rd-party modules, and even without any modules you do not use during the test.
Thanks for the advice, I’ll check out open_file_cache, it’s not used in my current nginx.conf I want to see if it makes much difference.
Would the modules affect it all that much? How much extra “junk” is there? I didn’t change the modules around for the other web servers so they’d all be running default in that aspect.
Rightly said, great analogy.
All of the above have specialization in different things such as in my opinion: nginx is best suitable for static file serving, and litespeed for PHP, SuPHP.
Thank you for this extensive Web server comparison.
One test parameter that this article did not report is the total elapsed time.
During our tests, we have seen that there is a huge difference between servers.
Serving more requests per second is good, but when this is done in a fraction of the time needed by others, then this is even better.
Good idea, I did have this information saved from my tests but forgot to include it. I’ve added it now and you can find it here. :)
Thank you for publishing the total elapsed time for each server.
The differences are so infornmative that this data deserves a dedicated chart :)
I was thinking about this when I put the data into a text file :) I’ve gotten around to it now, the image is in the post under the “Elapsed time of benchmarks” section, or here.
Hi, nice article.
Could you please benchmark the new version of G-WAN (3.12.25)?
And if you do, could you please not use a virtual machine, it think that the overhead of a VM is too big.
Thanks!
I’ll check out the new version. Unfortunately I don’t have any free server hardware spare currently to try this on a physical server. In my experience the overhead from the hypervisor is negligible.
Nonsense, context switching is context switching regardless if it’s on bare metal or a VM. Just, you know, distribute your workload. varnish, squid, memcached, g-wan all work well distributed. i haven’t had any problems with apache and nginx either.
give me 100 tiny VMs over 1 physical server any day of the week.
Nice article!
Have you tried benchmarking facebooks php hiphop vm software? It comes with built in web server and aplication server.
https://github.com/facebook/hiphop-php/wiki
Cheers,
Alex.
Hi Alex,
I haven’t personally used that one, I know of someone who has a while ago but apparently it was too buggy back then, I’ll have to check it out some time.
Hi Jarrod,
Thanks for your response. I had played with hiphop vm back in March by using a pre made ubuntu 12.04 LTS package. I’d made a small hiphop vm config file but I couldn’t figure out how to turn off request logging. Also back then the config settings weren’t well documented.
I haven’t used hiphop vm since then.
Looking at the git hub page for hiphop it seems there is more documentation. https://github.com/facebook/hiphop-php/wiki/Running-HipHop-VM
So when you have some spare time you can try it and if you like I can send you the config file.
Cheers,
Alex.
Hi Jarrod,
When you’ll make new benchmarks with latest versions of web-servers?
Not sure at the moment, don’t have a lot of free time to create servers and configure the web servers and test them as I’ve got some new projects which I might post about in the future. :)
Hi Jarrod,
I’m a fan of G-WAN and you made a terrifc job.
I’m also using the latest ab.c from Trustleap and I would love to reproduce your tests on my own system (AMD FX 8150 8 cores @ 4.2 GHz, with 32 Mb of RAM and 2 SSD Crucial of 240 Gb.) but on different distros to see if there are big differences.
However, I have not been able to discover how you have desactivated the log files of Apache2 (2.2.22) and Nginx (1.4.1).
Any hint would be trully appreciated.
TIA for your advices.
Hi Fnux,
Just comment out the lines that specify the directory that logging will go to then restart Apache/Nginx, load up the page in browser and confirm nothing has been written to the logs.
http://www.mydigitallife.info/how-to-disable-and-turn-off-apache-httpd-access-and-error-log/
Howdy,
LiteSpeed here.
Have you ever considered benchmarking LiteSpeed Enterprise or OpenLiteSpeed? LiteSpeed Standard has a limit of 150 concurrent connections and you can see the dip in performance when that mark is hit. Neither OpenLiteSpeed nor LSWS Enterprise have this limit. If you tried them, I think you’d find that Enterprise and OpenLiteSpeed would more than match nginx and other high-performance servers. Our own benchmarks suggest so.
OpenLiteSpeed is free and anyone can download a trial license of Enterprise for testing. I’d be happy to answer any questions about them you might have.
Cheers,
Michael
Ah that explains why the requests per second dropped a lot around the 150 mark.
I’m currently doing these tests again 3.5 years later, I’m using OpenLiteSpeed this time and it’s doing really well compared to the competition. :)
Fan boy bias towards GWAN. Nginx performs well over 700k requests per second on 24 core dual socket Westmere.
I’m not sure if you mean just in general, in which case I agree, or if you mean in my post, which I don’t agree too. I was just providing the numbers I got during my test, I can’t say I’ve ever used it since.
How much RAM was used each time?
Plus what OS have you been using, and any other changes in the background :shock:, because I am curios why nginx seems to be so slow on the 8 core test?
The server used was outlined at the start of the post, Debian 6 was used for the OS and 4GB of RAM was also used on the virtual machine.
There is a new book on Cherokee server, titled “Linux Web Server Development”. The book is available from Amazon at http://amzn.to/1BSabaG
Any chance you’d care to redo these tests? I’m interested in changes. I’m also interested in ram usage (how much ram was actually used by the process, not how much was in the machine) and cpu time.
I’m looking to do this in the new future, stay tuned!
The tests have been redone and I have included memory usage as well: https://www.rootusers.com/linux-web-server-performance-benchmark-2016-results/
Did you disable htaccess in Apache?
Settings were left default with the exception of logging which was disabled.
funny that you are using nginx for this site and not G-WAN
Easier to use with PHP, and it’s fast enough for me.
Is there any recent test data. How is the result?
It’s not a topic I have time to revisit unfortunately.